The total quantity of metal available for the reaction needs to be measured to characterize a catalyst sample. The available metal is measured in terms of a percentage of the total number of surface metal atoms against the total number of metal atoms present in the sample, which is also called dispersion. The equation is given below:
Dispersion, % = (No. Surface Atoms / Total No. Atoms) x 100
If a supported metal catalyst is being used, adsorbates can be chosen for a wide range of molecules, including nitric oxide, hydrogen, oxygen and carbon monoxide. However, it is critical to know the metal atom to adsorbate gas stoichiometry, the role of support material in adsorption, and if the molecule is adsorbed associatively or dissociatively.
This article demonstrates the method of determining the dispersion of a 5% Pd/Al2O3 catalyst using CO pulse chemisorptions.
Experimental
The pulsed chemisorptions are carried out in an oxygen-free environment. The sample is heated in a reducing atmosphere to remove any oxygen from the sample. The CATLAB microreactor was added with roughly 0.150 grams of 5% wt Pd/Al2O3 catalyst pellets that were accurately weighed.
This was followed by flushing the sample for 30 minutes using 60 ml·min-1 of He that was purified through the passage of O2 and H2O traps. The flow was then switched to 5% H2 in He at a rate of 60 ml·min-1.
The sample flushing was then carried out for 30 minutes prior to increasing the temperature to 473 K at a rate of 3 K·min-1. The sample was maintained at this temperature for 2 hours prior to switching the flow to 60 ml·min-1 of He to eliminate excess H2 from the system. The sample was allowed to rest in this condition and then cooled to room temperature under He flow.
Following activation, the sample was subjected to 30 pulses of a 5% CO in He mix. The volume of pulse sample loop was 100 ml containing 5% of CO. During the pulse experiment, the data for CO (m/z 28) was recorded using the QIC-20 mass spectrometer.
Figure 1 shows the resulting adsorption plot. From Figure 1, it is clear that considerable amounts of CO have been adsorbed for the first 20 pulses. Following this, the peak areas appeared to be identical, indicating that the sample had achieved saturated coverage.
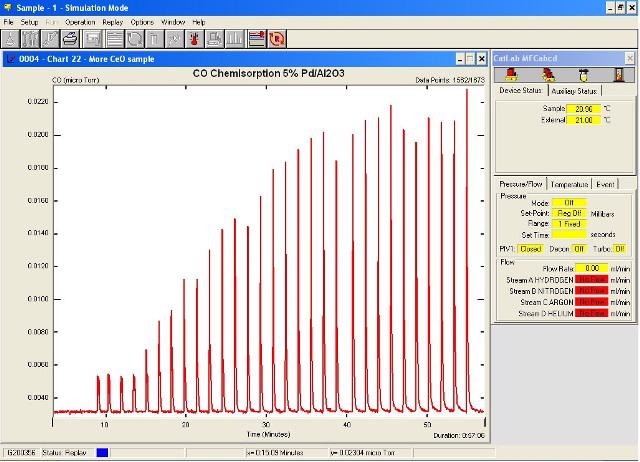
Figure 1. Pulse adsorption profile
The data obtained was then exported to the Hiden TPD Analysis Software so as to quantify the amount of gas adsorbed and hence the dispersion.
TPD Analysis Software
The TPD Analysis program is a standalone software package that comes with the Hiden CATLAB. This software package enables measurement of adsorption isotherms, dispersion measurements and total uptake measurements. Figure 2 shows the CO pulse adsorption profile in the TPD Analysis Software.
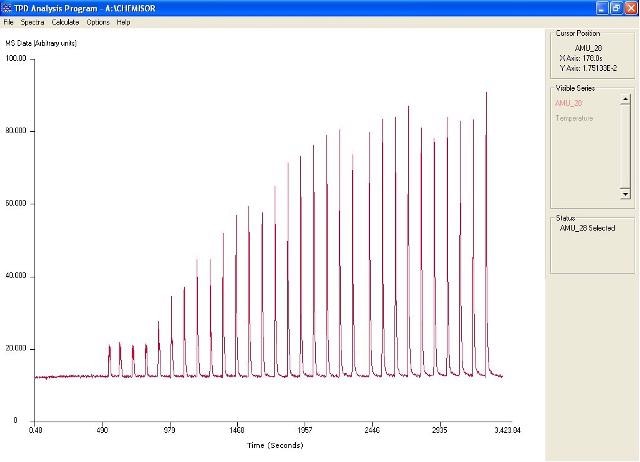
Figure 2. Pulse profile in TPD analysis software
Dispersion Calculation
The area under the curve for each pulse is integrated using the TPD Analysis Software, which then subtracts the results from the average area of calibration pulses. Calibration pulses are the ones that transmit via the catalysts without any uptake.
These are usually the last 3 or 4 pulses. The amount of gas adsorbed on the catalyst surface at each pulse is measured using this difference. Based on this information and data input by the user, the percentage of metal dispersion can be calculated using the software. The percentage of metal dispersion is shown in Figure 3.
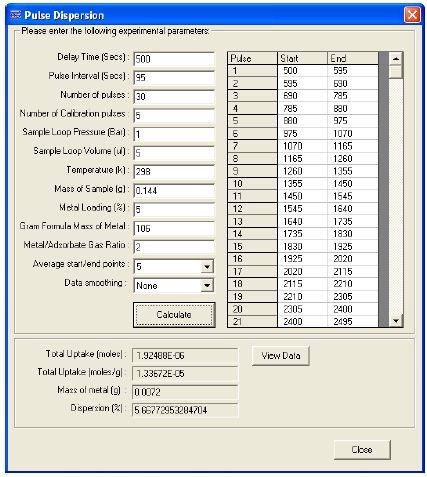
Figure 3. Dispersion calculation screen
It is critical to know the ratio of adsorbate gas to metal sites to measure the metal dispersion. CO can be correlated with one, two or three Pd atoms upon adsorption. The calculation of the exact ratio is based on the experimental conditions.
A typical ratio obtained for this kind of experiment is CO:Pd = 1:2. Using other analytical techniques, the ratio can be verified. Hence, 5.7% dispersion was calculated for the 5% wt Pd/Al2O3 catalyst.
Pulse Adsorption Isotherm
A pulse adsorption isotherm can also be generated with the same experimental data. The adsorption isotherm reveals the correlation between the surface coverage of an adsorbate gas and the sample exposure to an adsorbate gas.
The TPD Analysis Software screen for the adsorption isotherm of CO on the Pd catalyst is shown in Figure 4. Figure 5 shows the resulting isotherm.
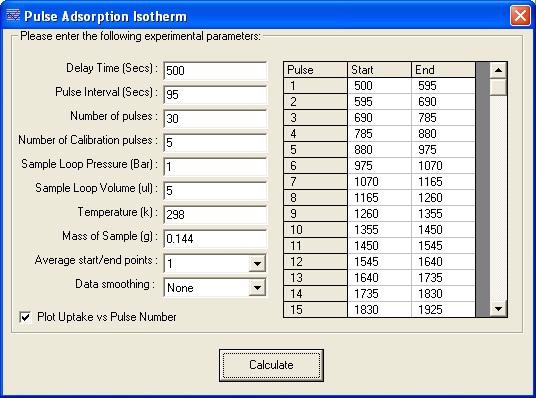
Figure 4. Pulse adsorption isotherm screen
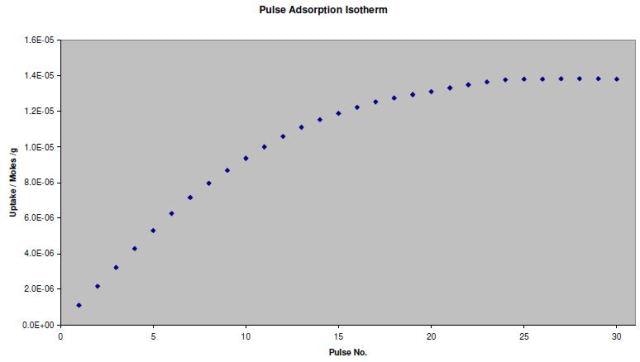
Figure 5. Pulse adsorption isotherm
Conclusion
This article has shown the ability of the close-coupled QIC-20 mass spectrometer within the PCS CATLAB microreactor system to provide high quality time resolved data, thereby facilitating the continuous and precise measurement of basic catalyst properties.

This information has been sourced, reviewed and adapted from materials provided by Hiden Analytical.
For more information on this source, please visit Hiden Analytical.