Development of technology to enable the real-time monitoring and control of pharmaceutical manufacturing methods has received a lot of attention in the recent years.
For instance, the FDA’s quality by design (QbD) and process analytical technology (PAT) initiatives are exclusively focused on such activities to promote a comprehensive understanding of methods used and to ensure efficient manufacturing of high-quality products without relying on unefficient post-production quality control.
Pharmaceutical protein crystallization is a method that must be heavily scrutinised, as it is a delicate process that can be easily affected by sensitivity to conditions, such as pH, temperature and concentration of species in the system.
This article will look at the way Raman spectroscopy is applied to study a laboratory-scale batch crystallization of lysozyme. Lysozyme is a common protein and was selected because its crystallization has been well researched, making it a suitable for a proof-of-concept experiment to confirm this process monitoring method.
Raman spectroscopy was used to examine the effects of temperature, time of crystallization and concentration of the precipitating agent. Additionally, how these factors interact with each other was also studied.
Experimental Procedure
This analysis used a D-optimal experimental design with dependance on the temperature, concentration of precipitating agent (NaCl) and time. Kaiser Optical Systems’ RamanRxn Systems™ Raman analyzer equipped with an Invictus™ 785nm laser was used for process monitoring.
The temperature applied for each sample was in the range of 15-45 °C for 9 hours and spectra were collected by subjecting the samples to 10 second exposures for 20 times after a 10 minute thermal equilibrium period. Spectra of solid lysozyme crystals were collected using a 10x non-contact optic, and spectra from aqueous solutions were collected using a ¼" immersion probe.
Results
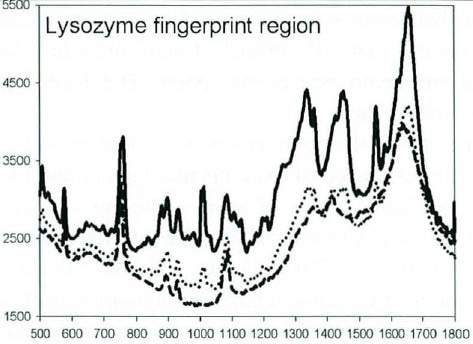
Lysozyme has functional Raman bands at 760, 750, 2940, and 155 cm-1. Besides the intensity of each band, the ratio of the 760- and 750 cm-1 bands provides practical process data. A comprehensive view of the fingerprint region for lysozyme ranging between 500 and 1800 cm-1 is depicted in Figure 1.

Figure 1. The Raman fingerprint region for lysozyme in acetate-buffered aqueous solution. Acetate concentrations: 90 mg/mL (solid line), 30mg/mL (dotted line), and 0mg/mL (dashed line). Useful peaks for quantitative analysis are found at 2940, 760, 750, and 155 cm-1.
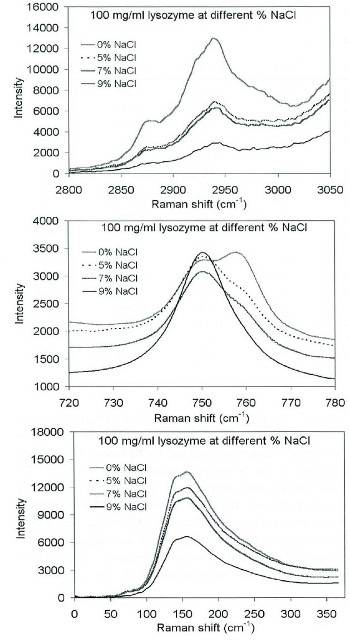
The relationship of lysozyme concentration in solution versus the concentration of NaCl as a precipitating agent can be seen in Figure 2. At 150 and 2940 cm-1 the lysozyme bands differ directly with NaCl concentration. The shape of the overlapping 750- and 760 cm-1 region is highly complex with one increasing when the other decreases.
For this particular research the 2940 cm-1 band proved to be highly useful for quantitative process monitoring; however the 760/750 cm-1 ratio also offered an excellent degree of validity.

Figure 2. Lysozyme spectra upon gradual addition of NaCl as the precipitating agent. Bottom spectra correspond to highest concentration of NaCl.
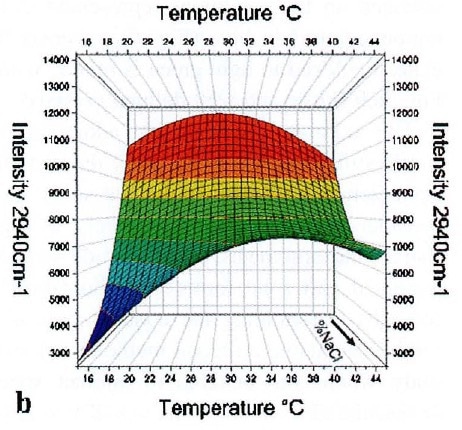
Contour plots (Figure 3) of the intensity of the 2940 cm-1 band were created corresponding to NaCl concentration and temperature using the multivariate data derived from the D-optimized experiment.

Figure 3. Surface plot of intensity of the 2940-cm-1 lysozyme Raman band with respect to temperature and NaCl concentration.
The combination of the surface plots and the visual analysis of the crystals formed revealed the suitable conditions (35-40 °C and 5-9% (w/w) NaCl) for lysozyme crystallization as specified by the lower intensity of the reference band.
Conclusion
These results have shown the ability of Raman spectroscopy to deliver comprehensive and quantitative process knowledge. This capability allows for rapid multivariate monitoring of protein crystallization processes, making Raman spectroscopy a potential tool to achieve control over a scaled-up process in real time.

This information has been sourced, reviewed and adapted from materials provided by Kaiser Optical Systems, Inc..
For more information on this source, please visit Kaiser Optical Systems, Inc..