Today’s production processes involve different types of image analysis to meet the requirements of many industrial applications. Various microscope manufacturers have designed software to serve as a jack of all trades, providing users with a range of tools to complete a specific requirement. However, multiple methods to perform an imaging or analysis process can lead to inconsistency between operators. In contrast, solution-based software is designed for specific processes and applications, walking users through step-by-step workflows. This straightforward approach enables less variability between operators for more reproducible, consistent results. This article shares examples of application-specific workflows for industrial image analysis.
Image acquisition and measurement software, such as Evident’s OLYMPUS Stream™ and PRECiV™ software, provide ease of use and guided workflows for various material analysis applications. These application-specific workflows are designed to increase the efficiency and consistency of image analysis in the industrial field.
Grain Sizing by Intercept Method
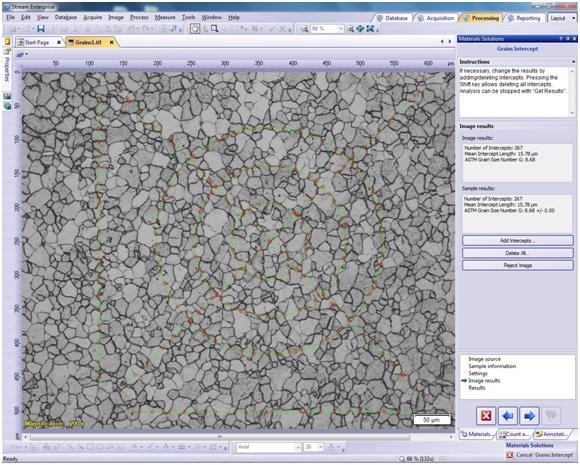
An example of an application-specific workflow offered by OLYMPUS Stream and PRECIV software is grain sizing. The Grain Intercept solution (Figure 1) guides operators through each step to execute a grain analysis. The first step is to choose the images to analyze. The next step is to enter the data about the image or sample of interest. This is followed by selecting variables, such as intercept pattern and boundary type (for example, bright, dark, or transitional). The grain boundary width interactively adjusts for real-time identification of the grains on the display.

Figure 1. Grain intercept measurements using ASTM E 112. Image and measurements are made using the Grain Intercept solution in OLYMPUS Stream software. PRECiV software offers a similar workflow with grain intercept and grain planimetric methods available in a single solution.
A noise reduction filter is used to filter out the noise caused by factors such as scratches in the images of interest. The resulting grain size is then calculated and added to the workbook data or directly to a report. It is possible to save and recall all the variables chosen during the process, enabling different operators to perform a similar analysis with the same variables. The software is also designed for standards such as ISO and ASTM to help users fulfill compliance requirements.
If the operator does not have a grain intercept solution in their software, they would need to perform grain sizing manually. To start, they would create reference lines on their images, then decide which lines are the borders in the image. Next, they would need to manually count the intercepts on the borders along the reference lines. The last step would be to calculate the grain size with the number of intercepts per the distance of the reference lines. Manually performing all these steps would be time-consuming and increase operator variability.
Material Analysis Solutions
Evident has created a wide variety of other material analysis solutions to facilitate guided analyses for specific applications. These solutions all share a similar workflow: the user selects images for the analysis, inputs any desired sample information, completes other steps for the specific solution (typically includes thresholding), and creates a report or workbook for the results.
Phase Analysis: Helps execute phase analysis on an entire image or choice of various regions of interest (ROI), including polygons, rectangles, circles, and triangles. Users are guided through all steps, and results are cumulated on multiple images.
Particle Distribution: Particle size distribution histograms and tables are created from multiple images or image series. It is possible to select any type of measurement parameter, such as area or diameter. Also, graphical representation of the distribution can be easily produced.
Coating Thickness: Measures coating thickness from top-view images using the calotest method, where a grinding sphere is applied to a plating and the plating thickness is measured from the sample geometry and sphere geometry.
Porosity: Uses ROIs and thresholds to measure pores and determines pore density automatically on the image. A specific range of pore sizes can be selected to attain the required reproducibility.
Grain Planimetric: Uses the planimetric method to determine the grain size number G. It is developed for steelmakers quantifying and controlling grain size after etching, polishing, or cross-sectioning steel samples.
Chart Comparison: Can be applied for ASTM grain size number evaluation, cast-iron shape class evaluation, and nonmetallic inclusion rating. Carbide structure in steels can also be analyzed.
Inclusions Worst Field: Developed for steelmakers who quantify and control the size and shape of nonmetallic inclusions, such as silicate, sulfide, alumina, and oxide in steel. Nonmetallic inclusions can be automatically evaluated with results in accordance with international standards.
Cast Iron: Designed for casting manufacturers measuring and controlling graphite nodularity to refine the mechanical properties of cast products. It is possible to calculate nodularity by graphite shape, size, and distribution.
Throwing Power: Can be used to measure the copper plating thickness distribution in microvias or through holes. It directs the quality examiner of printed circuit boards through all the measurements required for identifying dimple depth.
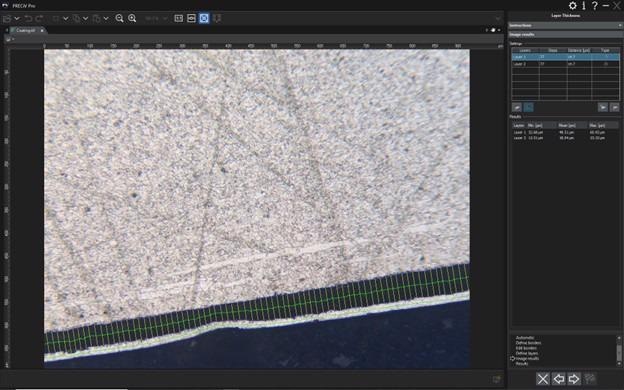
Layer Thickness: One or multiple layers of a cross-sectioned sample can be measured (Figure 2). It is used for a range of applications, including multilayer thickness evaluation and paint-coating thickness evaluation.
Automatic Measurement: Measurements can be created on a live image with pattern recognition based on edge detection. Multiple measurements can be performed on a single image. It also enables repositioning of already processed samples.

Figure 2. Bonding material and surface coating measurements are made using the Layer Thickness solution in PRECiV software.
In addition to the material analysis solutions listed above, Evident can develop customized solutions to meet user requirements, such as company-specific measurement routines or standards.
Layout configuration and macro scripting are two other options.
A macro enables operators to record several steps in the software to a single step or a reduced set of steps. The operator inputs the data, and the associated chance for error can be reduced by scripting in a macro.
When the layout of the software is specifically configured to fulfill the requirements or specific steps of users, unnecessary options are eliminated. This minimizes the selection of the wrong function or the chance of mistakes.
Layout configuration and macro scripting are valuable options to users who lack a predefined solution to fulfill their specific requirements. These solutions take away unnecessary options and steps and provide a focused application to satisfy specific user requirements.
Conclusion
Evident’s solution-based software options for image acquisition and analysis offer industries a variety of tools for diverse applications. Material analysis solutions provide a guided workflow to decrease the variability of analyses from different operators and increase efficiency through semi-automated and automated calculations. These solutions can be added to both OLYMPUS Stream and PRECiV software to personalize workflows for inspection and research requirements. Layout configuration, macro scripting, and custom solutions provide further ways to customize the software.
To learn more about Evident’s solution-based software options for industrial image analysis, visit EvidentScientific.com.

This information has been sourced, reviewed and adapted from materials provided by Evident Corporation - Industrial Microscopy.
For more information on this source, please visit Evident Corporation - Industrial Microscopy