Microscopes are traditionally used by a trained examiner to match a bullet to a firearm by comparing the striations on each available ‘land area’ on the bullet against the land areas on a known bullet that has been fired from the firearm. This process is reliable, but laborious and subjective.
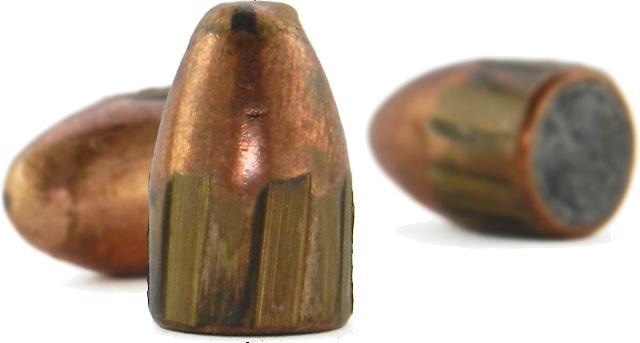
Figure 1. Land surface measurement
Methodology
Sensofar employs optical 3-dimensional metrology to acquire quantitative data on bullet lands. Their new program SensoMATCH® carries out IC and bullet comparison in a fully automated manner. Figure 2 outlines the five steps typically involved in this comparison process:
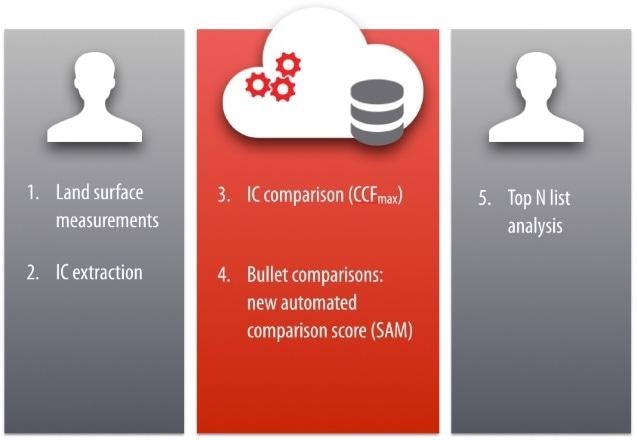
Figure 2. SensoMATCH® performs IC and bullet comparison in a five-step process
Mean profiles from each surface are extracted and a cross correlation function (CCFmax) is calculated using this data to mathematically compare pairs of IC surfaces (Figure 3). The CCFmax value for identical profiles is found to be 1.0. A lower CCFmax value in the range of 0.2-0.4 is obtained for lower correlations. Therefore, higher scores signify the confidence level of a match.
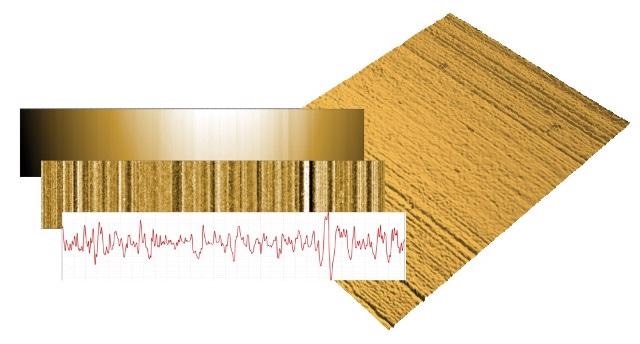
Figure 3. IC surface and mean profile
SensoMATCH® Streamlines Bullet Comparison
To simplify analysis, a single composite score can be calculated for each bullet pair – Sequence Average Maximum (SAM) – that clearly indicates a match between bullets. The threshold value is specified by the user to determine matches. A single comparison of two bullets, each with six lands yields 36 CCFmax scores in a 6x6 matrix (Figure 4).
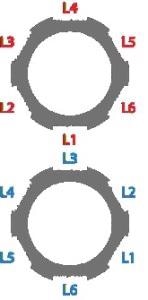
Figure 4. A single comparison of 2 bullets each with 6 lands results in 36 CCFmax scores in a 6x6 matrix
This comparison task very rapidly scales, involving comparison of 15 unknown bullets to 20 known bullets, yielding 10,800 scores in 300 matrices (Figure 5). It is possible to process the entire John Hamby dataset in approximately 4 seconds, providing a spreadsheet that determines the top matches for each unknown bullet (Figure 5).
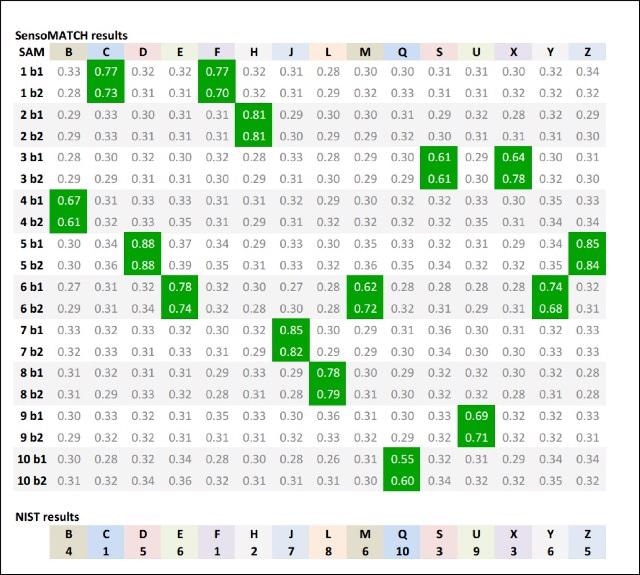
Figure 5. John Hamby test is correctly solved (SAM threshold 0.5)
Additional Features
The following are the additional features of SensoMATCH®, which make it a suitable solution for research in bullet comparisons using 3D surface metrology:
- Training mode
- Missing lands compatibility
- SensoMAP template for IC comparison by employing customized data processing and comparison parameters
- Comparison of a set of known bullets to itself helps determine statistical values for ‘Known Matches vs. Known Non-Matches,’ which are then used to define SAM thresholds (Figure 6)
- This approach to data analysis can be performed using a range of optical metrology systems, including the Sensofar family of optical metrology systems
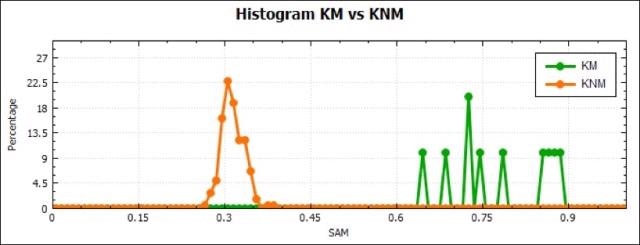
Figure 6. Establishing SAM threshold based on the histogram of CFFmax values

This information has been sourced, reviewed and adapted from materials provided by Sensofar.
For more information on this source, please visit Sensofar.