In the soap industry, the preparation of the final product involves many chemical reactions. In these industries, a high control of reactions forms a key part of the quality control mission to guarantee the non-invasity of the end product on the human skin. There are various soaps that also contain additives as dyes or fragrances that should enhance the commercialized result.
Yet, these additives could play a role in chemical reactions and their presence in the final bar can possibly be questioned. This article shows how the presence of additives and/or traces of reagents in soap bars are investigated using Raman micro-spectroscopy, and more particularly Raman mapping.
Experimental Conditions
Raman spectroscopy is a non-destructive chemical analysis method, which offers comprehensive knowledge about chemical structure, crystallinity, polymorphism, phase and molecular interactions. The technique is based on the interaction of light with the chemical bonds within a material. The system used here is an XploRA™ PLUS that integrates robust and unique functions in a dependable, high-performance system, which is perfectly suited for the analytical and research labs. The system is entirely confocal, offering high image quality, depth, and spatial resolution.
Soaps are complex products that may contain several organic compounds. These compounds may scatter fluorescence when interacting with a laser source. As one would like to achieve the proper Raman signal, it is essential to reduce the fluorescence emission as much as possible. Based on the scattering of the fluorescence level by the different soaps, different lasers (638 nm, 785 nm) have been employed to obtain the Raman fingerprints of the compounds. The soaps have been mapped with the laser using a 50xLWD objective in order to identify reactive traces and/or additives, and also to obtain the chemical distributions of the various compounds. The acquisition time was one second per pixel of 2x2 µm-sizes.
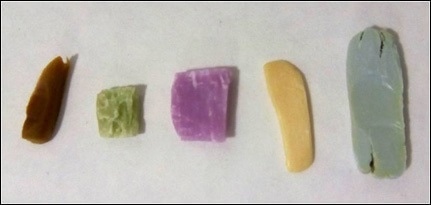
Multiple soap bars were examined: A low-cost soap, Marseille’s soap, grape seed oil soap, Aleppo soap, and olive oil soap. The first two soaps are industrial products, and the other three are handmade.
Regarding composition, soaps are conventionally a mixture of glycerol, oils/fatty acids, and many additives like dyes, perfumes, emulsifiers, and so on. Improving the final product is the intent of all of these additives.

Figure 1. Pieces of soap studied by Raman spectroscopy. (From left to right) Aleppo soap, olive oil soap, grape seed oil soap, Marseille's soap, low-cost soap.
Results
A Raman map was obtained for each of the soaps. A Multivariate Curve Resolution (MCR) analysis was applied on the different maps to highlight the different compounds. For each map, the colors are based on the decomposition on the related reference spectra. Subsequently, these acquired reference spectra were compared with the Raman KnowItAll® databases provided with LabSpec6 software and powered by BIO-RAD.
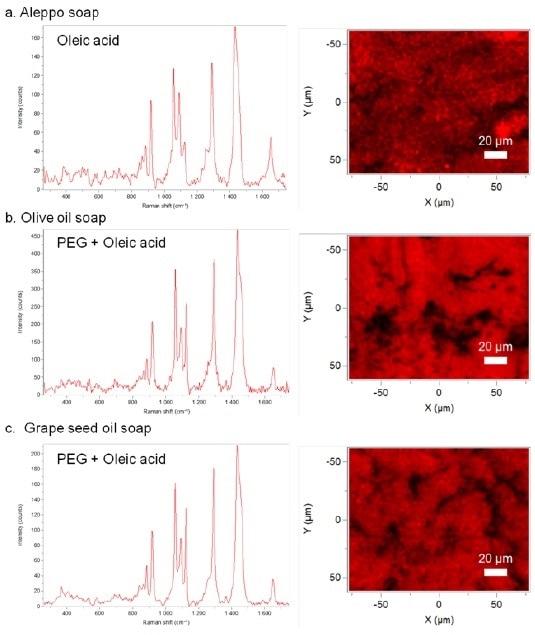
The handmade soaps were first examined. Figure 2 demonstrates the Raman maps of different soaps.

Figure 2. Raman reference spectra and Raman maps of different handmade soaps. Raman spectral identifications based on KnowItAll® databases. (a) Aleppo soap. (b) Olive oil soap. (c) Grape seed oil soap.
Based on the Raman analyses, it is obvious that oleic acid is the main compound of all soaps. The contribution of poly-ethylene glycol (PEG) is also obtained in the more manufactured handmade soaps. PEG serves as an emulsifier in the soap composition. This greater difficulty in the formulation, compared to the Aleppo soap, was anticipated. Aleppo soap is indeed a simple soap made from lye and olive oil. Rather than adding PEG to the grape seed oil and olive oil-based soaps, the distributions of the elements are comparatively homogeneous and no other compound was identified for these soaps. This homogeneity is the direct outcome of the handmade manufacturing during which all elements of soap are highly combined together.
In order to infer the lack of differences between the two complex handmade soaps, it is significant to observe that these soaps were produced by the same company. This shows the homogeneity between the two soaps composition/formulations.
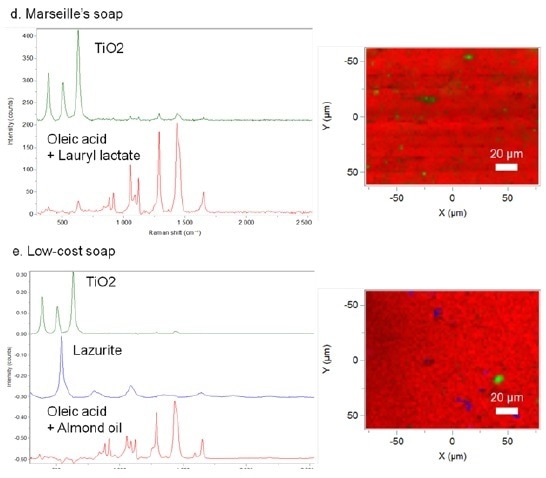
Industrial soaps were the second kind of analyzed soaps. Figure 3 shows the Raman maps of the different soaps.

Figure 3. Raman reference spectra and Raman maps of different industrial soaps. Raman spectral identifications based on KnowItAll® databases. (d) Marseille's soap. (e) Low-cost soap.
It is clear from the Raman chemical analyses that these soaps are not from handmade production. The soap compositions are indeed less homogeneous and some single compounds are detected. Therefore, TiO2 was found in both low-cost and Marseille’s soaps. Mainly used in the soap industry, TiO2 has an ability to lighten the soap color. With regards to low-cost soap, pigment molecules are also noticed (lazurite). Poor mixing of all of these compounds confirms the industrial preparation of these soaps. Raman is an excellent method for investigating the presence/absence of additives and for evaluating the quality of soap preparation.
Another advantage of Raman spectroscopy is that it can differentiate between the various oils used during the preparation of soaps.
Conclusion
To conclude, this article has demonstrated the robustness of Raman micro-spectroscopy for characterizing soap homogeneity and for investigating the presence/absence of additives or traces of reagents in the end product.

This information has been sourced, reviewed and adapted from materials provided by HORIBA.
For more information on this source, please visit HORIBA.