Finely-cut diamond abrasive is utilized in the manufacture of industrial drills, grinding wheels and discs, dental instruments and lapidary apparatus. The grinding tools are subsequently implemented in the production of steels, alloys, ceramics, glass, granite and other materials. Two sizes, or grits, of abrasive were examined here. A regular raw image of particles from both of the samples is presented below.
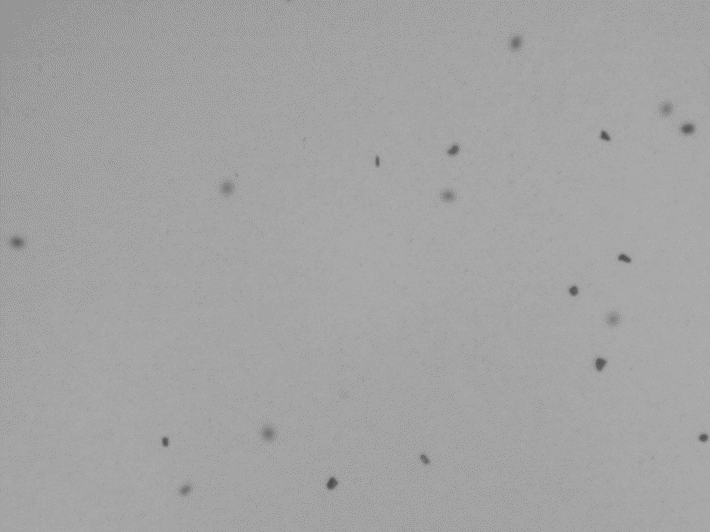
Image Credit: Vision Analytical Inc.
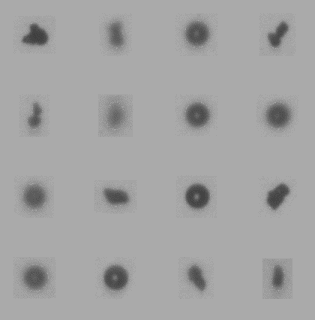
The first sample contains very fine sizes. There are also a few spherical bubbles present. They are between about 30 and 40 microns in diameter.
Image Credit: Vision Analytical Inc.
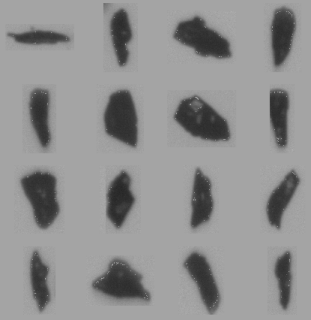
The second sample has considerably larger grains, with straight-faceted sides. Some of the sides are convex and some are concave.
Image Credit: Vision Analytical Inc.
Size distribution is typically of strong interest. However, because the abrasive grains are not spherical, a singular size measurement is not sufficient. Particle morphology measurements, comprising both length and breadth, is thus required. Particle morphology bears strongly on abrasive effectiveness. A polygon morphology characterized by sharp angles is the optimal performer.
For size calculation, the elliptical methodology is the most effective model. Although the particles are not elliptical, an ellipse can be fitted, which will yield an effective measurement of length, breadth and aspect ratio. In this case, the least bounding ellipse is utilized. For morphology, the polygon model is implemented, as the majority of particles possess a polygonal appearance, with straight sides.
The quantity of fitted polygon sides is measured as polygon order, and the polygon angles category describes the interior angles of the polygon. Convexity indicates the degree to which a particle embodies a convex morphology, in other words how well it matches the fitted polygon. A particle characterized by indented sides would embody a lower convexity than one which filled the majority of the polygon.
| |
Measure |
Range of Acceptance |
| Applicable Measures |
Bounding Ellipse Width |
3 – 500 microns |
| Bounding Ellipse Length |
10 – 500 microns |
| Ellipse Aspect Ratio |
0 to 1.0 |
| Polygon Order |
0 to 25 |
| Polygon Angles |
0 to 180 |
| Convexity |
0 to 1.0 |
| Smoothness |
0 to 1.0 |
Image analysis settings comprised minimum pixel area: 5; maximum pixel area: 50000; binary threshold: 80%; focus rejection parameter: 50; pump speed: 40%, and the option to adjust dimensions for diffraction effects was allowed.
Results
Sample 1
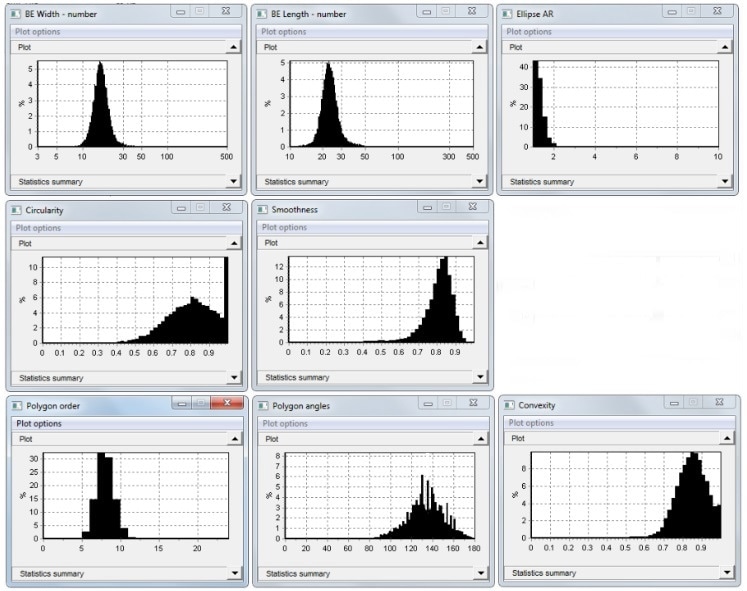
Image Credit: Vision Analytical Inc.
Approximately speaking, length and breadth are typically distributed with every aspect ratio under 2. Quantity of sides (polygon order) averages between 7 and 8. Interior angles are distributed around 135 degrees. Convexity has a spread to its distribution but is fairly high. Circularity exhibits a spike at 1 as a result of the occurrence of the spheres.
Utilizing the post-processing filter, the capacity for reanalysis of the particles, without the spheres, is enabled, by imposing an upper limit of 0.99 on circularity.

Image Credit: Vision Analytical Inc.
The data exhibits only minimal change, due to the fact that the spheres comprise under 10% of the sample (1430 out of 15114).
Sample 2
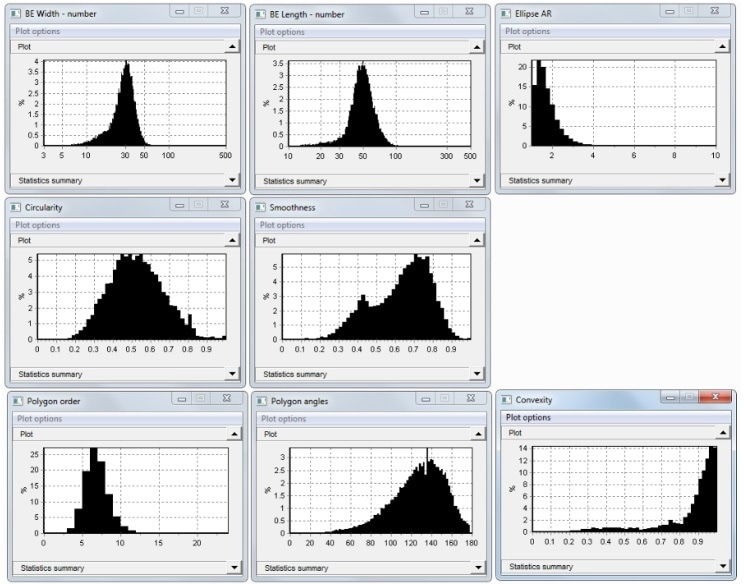
Image Credit: Vision Analytical Inc.
In the second sample, the bounding ellipse breadth average increased to 28.7 microns, compared to 17.0 in the first sample. Bounding ellipse length likewise grew from 23.9 to 49.4. For these larger abrasives, both circularity and smoothness are smaller than the fine particles constituting the first sample.
Polygon order is roughly the same in this instance. Interior angles exhibit a comparable average, but the histogram now describes a typical skewed normal distribution. A high quantity of the particles in the first sample is too fine to calculate angularity. The larger abrasives possess a higher convexity.
A third sample was generated from the first and second samples for demonstration reasons. Examination of the third mixture reveals the occurrence of the two original materials, in disparate quantities. It is possible to isolate the two components with the use of one of the Particle Insight separation techniques, and correlate the results with the initial samples.
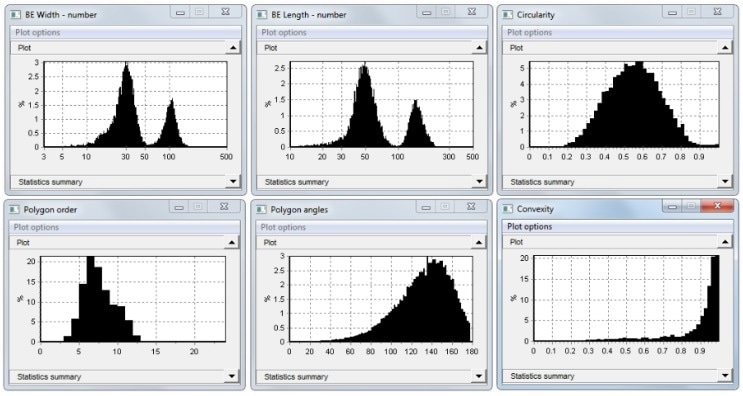
Image Credit: Vision Analytical Inc.

This information has been sourced, reviewed and adapted from materials provided by Vision Analytical Inc.
For more information on this source, please visit Vision Analytical Inc.