Particle size has long been a key method for characterization. Most particle size measurement techniques are indirect and assume that all measured particles are round when providing size results.
However, many particles in manufacturing are not round, which raises concerns about the accuracy of size-only techniques for providing complete characterization data. Abrasive particles represented as round particles, for example, would indicate a 100.1 µm particle.
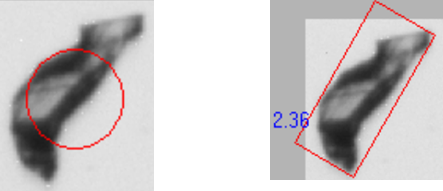
Image Credit: Vision Analytical Inc.
- Size: 100.1 µm
- Smoothness: 0.509
- Circularity: 0.321
- Bounding rectangle aspect ratio: 2.36;
- Width: 82 µm
- Length: 193.2 µm
Irregular particle shapes can significantly influence particle interactions, flow behavior, and compaction, ultimately affecting the effectiveness of final products.
To address this, researchers have advanced particle characterization by incorporating both size and shape measurements through direct techniques such as microscopy.
Although microscopy is slow and labor-intensive, it allows operators to acquire qualitative data about the particles in raw materials. However, for practical purposes, it is typically limited to measuring a small sample of particles.
In the early 1990s, advances in machine vision cameras and more powerful computers enabled more consistent analysis of particle shapes with much higher sampling rates.
Image analysis, which involves rapid processing of images from static or dynamically moving particles, emerged as a competitive approach to traditional size-only techniques like laser diffraction. Commercial shape analysis systems, introduced in the 1990s and 2000s, began to rival established size-only methods like laser diffraction.
As with any innovative approach, it took several years for the industry to fully recognize its value. By around 2014, innovative shape analysis systems like the Particle Insight Shape Module were developed to complement existing size-only tools.
Today, shape analysis has become a complementary method to various size-only techniques. Its high resolution and flexibility have also enabled its integration into other applications, such as online particle analysis.
Particle Shape Analysis Beyond Size Measurements
Particle size is a crucial measure for raw materials, and as a result, dynamic image analysis equipment always provides particle size alongside shape measurements.
This is done because particle size is well-established, and users typically compare the data with their current methods. An overview document is available, comparing particle size results across different techniques and shapes.
Dynamic image analysis is a number-based approach that measures particles independently. Other industry methods, also number-based, provide individual particle data, including count and concentration, which are essential for various industries.
As a direct measurement technique, dynamic image analysis evaluates the actual particle, reporting particle size in both volume-weighted and number-weighted distributions.
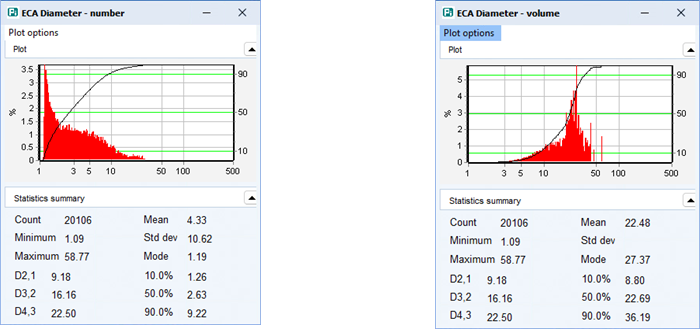
Image Credit: Vision Analytical Inc.
The images above illustrate a sample's number-weighted and volume-weighted distributions. Accurately recording both results is essential, as monitoring and controlling the number of fine particles in a sample can impact larger particles' flowability, cause filter clogging, or identify debris that could affect the procedure.
Equally important is tracking volume-weighted particle size data, as it helps detect accumulations or large particles in raw materials, which can influence the quality of the final product.
Dynamic image analysis is a number-based approach, and the histogram represents each individual particle in the sample.
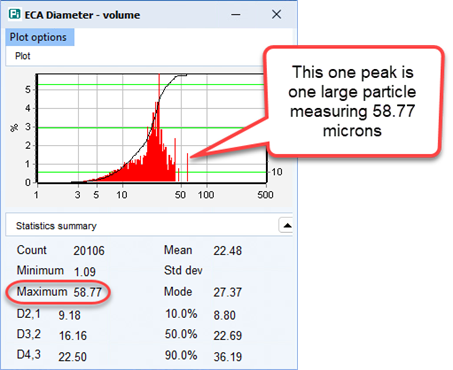
Image Credit: Vision Analytical Inc.
Today, many scientists and users recognize that particle shape instrumentation serves not only as a characterization tool but also as a powerful identification tool. For characterization, shape analysis is often employed to quantify the percentage of different particle types within a mixed sample.
For example, in the graph below, an analyst might conclude from the size histogram alone that all particles are around the 50-micron range, with a few unusual peaks.
However, relying solely on size data often requires an expert to interpret the graph and associated statistics to fully understand the sample's composition. In reality, as this example demonstrates, the sample contains three distinct particle shapes, offering a much clearer picture of its true composition.
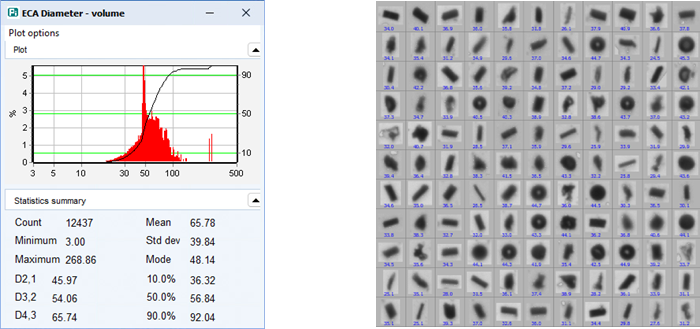
Image Credit: Vision Analytical Inc.
These differently shaped particles all have a size-only measurement of approximately 35 μm when analyzed using size-only data. However, these diverse shapes will behave differently during processes, affecting compaction, flow, and overall performance. Therefore, additional shape measurements are necessary to detect and differentiate the separate particle classes.
As shown above, dynamic image analysis also provides thumbnail images of each measured particle. This technique offers over 30 shape measurements for each particle, allowing for differentiation and providing a visual representation as objective evidence. This eliminates the need for an expert to interpret data solely from statistical graphs and numerical values.
In many cases, variations in shape, rather than size, can be used to identify different raw materials. The particle thumbnails enable users to recognize large particles as agglomerates, bubbles, or contamination, providing insights into the composition and quality of the sample.
Other Shape Measurements Made with Dynamic Image Analysis
The Particle Insight product line from Vision Analytical provides over 30 size and shape measurements across six distinct shape models, offering the ability to correlate any two measurements to detect rare event particles. While not all shape models will be relevant to every user, one or more may be critical for specific applications.
For example, with rod-shaped particles, both length and aspect ratio might be equally important. For abrasive powders, monitoring Circularity and Smoothness can be crucial for performance.
Identifying which of the six shape models best aligns with your key performance metrics is essential. For instance, if samples containing a mix of round and rod-like particles are not separating or compacting effectively, monitoring the ratio of round (circular model) to long (length models) particles could be particularly useful.
Particle Characterization Shape Models
Circle: Equivalent area (Heywood) diameter, equivalent perimeter diameter, bounding circle diameter, circularity, form factor, compactness.
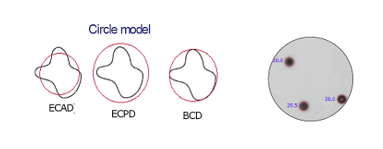
Image Credit: Vision Analytical Inc.
Ellipse: Equivalent area diameter, bounding ellipse diameter, ellipticity.
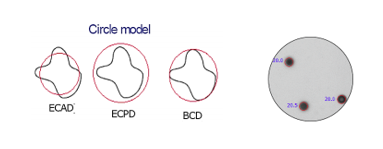
Image Credit: Vision Analytical Inc.
Rectangle: Bounding rectangle length, width, aspect ratio, rectangularity.
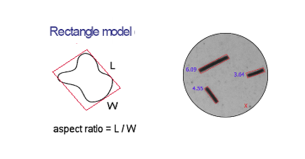
Image Credit: Vision Analytical Inc.
Polygon: Polygon order, convexity, interior angles.
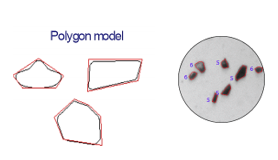
Image Credit: Vision Analytical Inc.
Fiber: Length, width, aspect ratio, curl.
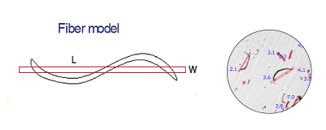
Image Credit: Vision Analytical Inc.
Irregular: Feret length, width, aspect ratio, mean radius, smoothness.

Image Credit: Vision Analytical Inc.
Pixel Intensity: Opacity and white fraction.
Opacity: The particle’s intensity mean is 0 (black) and 255 (white). Opacity is recorded as (256 – [Intensity Mean])/256.
Zero is fully transparent; 1 is fully opaque.

Image Credit: Vision Analytical Inc.
White Fraction: The white fraction is the particle area lighter than the dark threshold in analysis conditions options.

Image Credit: Vision Analytical Inc.
Benefits of Particle Shape Analysis
Many researchers today recognize that particle shape equipment can serve as both a characterization and identification tool. Shape analysis is often used in characterization to measure the percentage of different particle types within a mixed sample.
For example, an operator can measure the percentage of excipient to active pharmaceutical ingredients after mixing, and then perform precise measurements before tableting to ensure consistency and quality in the final product.
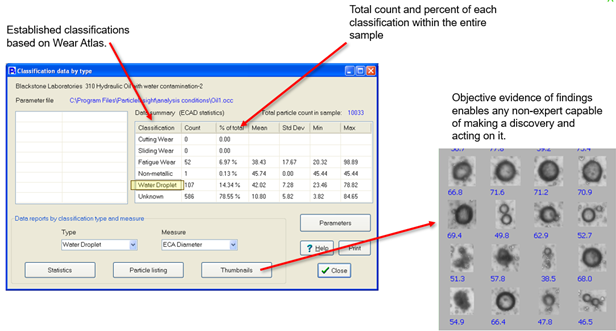
Image Credit: Vision Analytical Inc.
Shape analysis also allows for the detection of rare events, such as contamination particles or agglomerates, which can be challenging to identify and quantify in certain applications. Operators can use functional correlation plots to easily pinpoint particles of interest and generate thumbnail images as objective evidence.
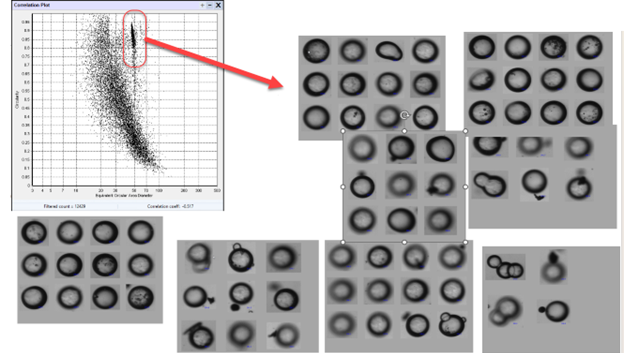
Image Credit: Vision Analytical Inc.
Dynamic analysis techniques offer several additional benefits for particle shape analysis, including the ability to provide accurate particle size measurements, detect rare events, and organize particles based on their characteristics.

This information has been sourced, reviewed and adapted from materials provided by Vision Analytical Inc.
For more information on this source, please visit Vision Analytical Inc.