An extremely frequent practice in many industries is investigating raw materials using particle size. Particle size measures are now one of the standard inspection criteria for incoming materials and outgoing products that everyone uses in daily life. Particle size analysis is the predominant method for powders and other granular materials. However, how do you define “particle size”?
Challenges Faced While Analyzing Particle Size Distribution
As most powder granules in the industry have irregular shapes, the question posed does not have a straightforward answer. Industry, as a rule, circumnavigates the problem by deciding a single size, or “diameter”, for each particle while implicitly assuming that the particles are spherical. Even when it is understood that the grains are not round, it is typical practice to use a measurement technique that produces a single size value for each particle resulting in a size-only statistical histogram and values.
Various types of instrumentation with different technologies will most definitely report a different size value for the same particle, particularly if it is irregularly shaped. The more impactful issue is that size-only statistics are insufficient to determine how the nonspherical materials function. Size-only instrumentation and statistics cannot satisfactorily characterize these raw materials. This is particularly the case if a sample contains more than one type or classification of the particle, as in the following example.
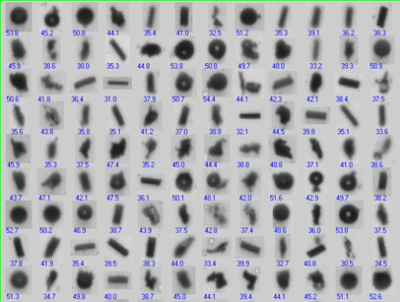
All these particles – spheres, irregular shapes, and fibers – report a size-only equivalent circular diameter of about 40 μm.
Image Credit: Vision Analytical
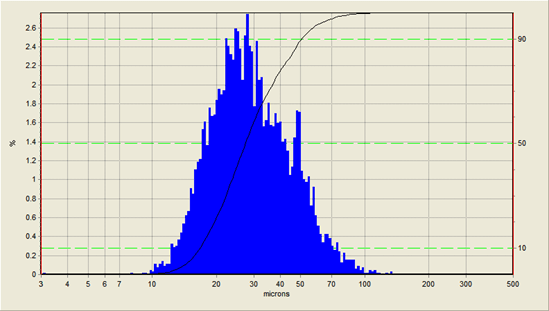
The assumption that all particles are spherical can be misleading and will not alert the end user of any issues that can impact the final product.
Image Credit: Vision Analytical
When powder particles are elongated or fibrous, it is apparent that length and width measures are a necessity at the very least to assess them properly. But even with low-aspect ratios, which means particles are not elongated, they can still be irregular. To predict performance, it may be a requirement to obtain statistics on other shape measures to better classify these irregular particles.

Image Credit: Vision Analytical
Solution
“Circularity” is a measure of roundness of the particle silhouette, and by inference, the degree of sphericity in the range from 0 to 1.0. It is computed from the perimeter and area of the actual particle silhouette. Also, surface smoothness from the shape of the particle outline can be measured.
Another measure, “convexity,” reports how “regular” the shape is from a bigger perspective; that is, to the extent it is free of indentations and protrusions. All these measures are possible and significant even for approximately spherical shapes.

Image Credit: Vision Analytical
Aspect ratio, circularity and smoothness inform us about non-spherical objects:
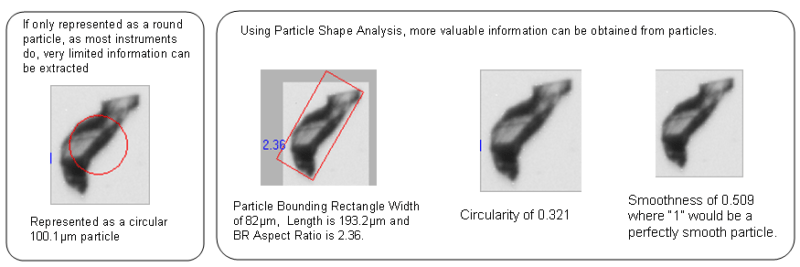
Image Credit: Vision Analytical
In particular industries such as abrasives, it is sometimes of value to garner further shape information, for instance, the number of polygonal sides and the interior angles. Multiple shape parameters are commonly used to quantify and compare lots of different materials or similar materials from various suppliers.

Image Credit: Vision Analytical
In the case of rectangular or fiber samples, a single size-only value is far from enough to quantify the sample properly. We need to know the distribution of widths present, lengths, or both, and statistics concerning the aspect ratios. Additionally, surface smoothness may be significant in these scenarios and fiber curl.

Image Credit: Vision Analytical
A powerful feature of shape analysis is the ability to correlate shape statistics with size statistics to view how shape transforms with size. This is formed as a scatter diagram, with one point representing each particle. This correlation plot displays all the analyzed particles correlated by any two shape measures and enables the user to then view any or all of the particle thumbnails of interest. This is an ideal tool for identifying rare events of a few particles in a large population of tens of thousands of analyzed particles.
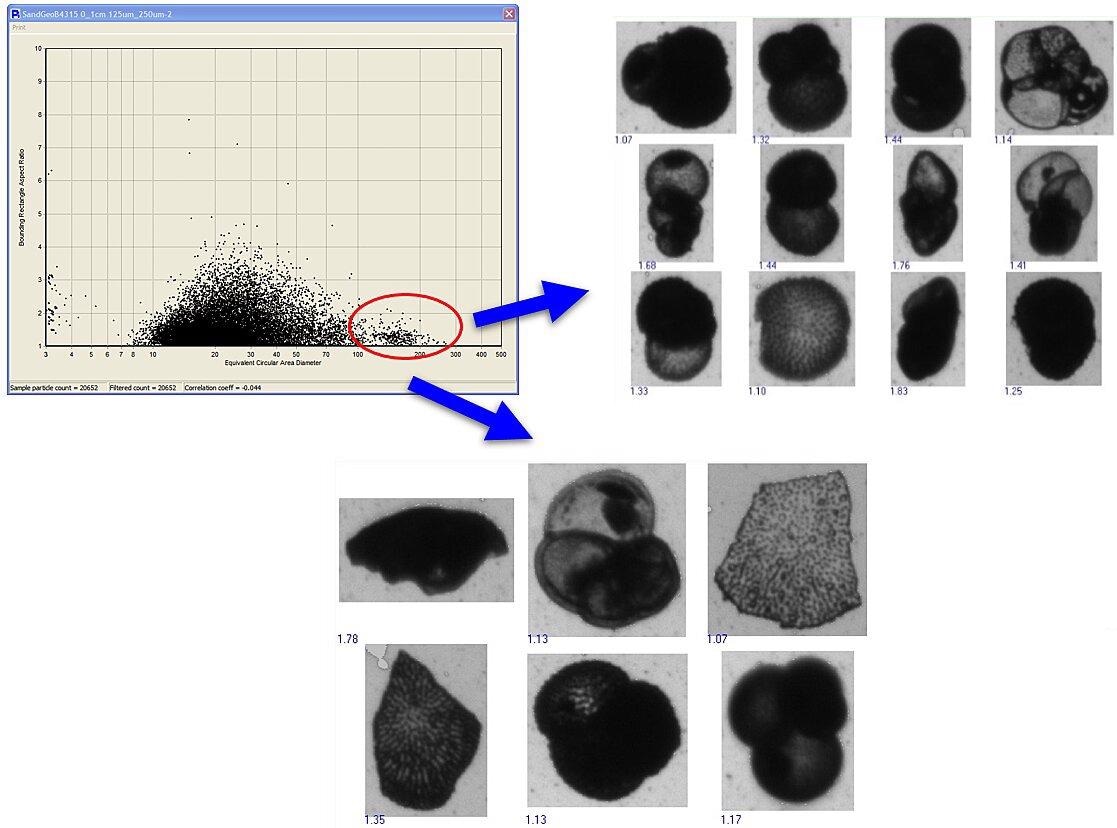
Image Credit: Vision Analytical
Another powerful feature of shape analysis is defining subcategories contained in a sample using size and shape simultaneously. This classification feature enables the independent investigation of two or more classes of particles. Statistics can be derrived from any of the classes at one time, thumbnail images for each class can be viewed, and each class's percentage can be reported.
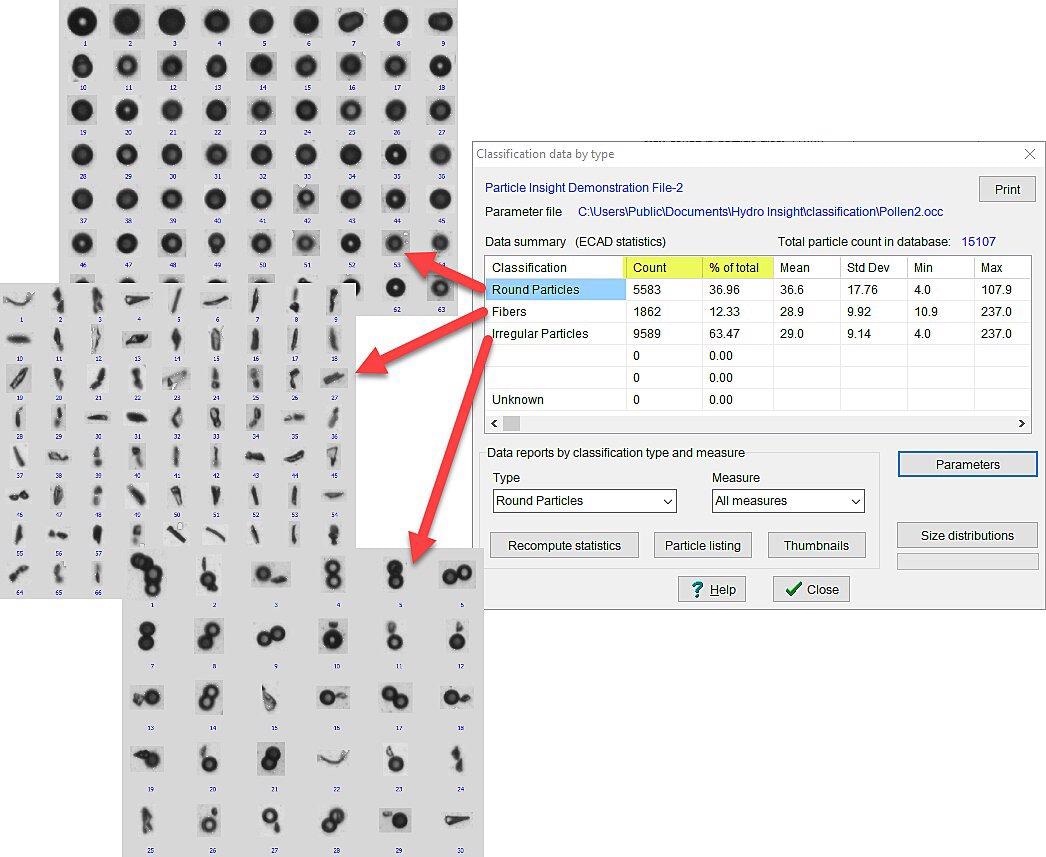
Image Credit: Vision Analytical

This information has been sourced, reviewed and adapted from materials provided by Vision Analytical Inc.
For more information on this source, please visit Vision Analytical Inc.