Minerals come in a variety of forms and have many uses, some being valuable jewels but others being used chiefly as abrasives, to make a surface smooth by rubbing off imperfections and projections. Some abrasive minerals include silicon dioxide, diamond, garnet and aluminum oxide. Abrasives have a host of applications in real life, such as planing surfaces during the manufacture of computer components and DVDs, making sandpaper, grinding and cutting wheels, removing skin blemishes or birthmarks, making floors anti-skid, making toothpaste, producing kitchen and bathroom cleaners and hand cleaners.
However, a material must have certain specific properties to be a good abrasive. Among these are hardness and sharpness (which allow it to abrade other surfaces), and toughness, which helps the abrasive itself to resist abrasion. For grinding, polishing or the removal or a surface, the abrasive must be harder than the surface selected to be treated.
Abrasive materials are often taken from mines. Natural abrasives of this sort include diamond, garnet and aluminum oxide. Synthetic abrasives are more common in industrial use as their supply and quality are easier to ensure. These include silicon carbide, alumina and synthetic diamond. There are three major scales of hardness, the Mohs, Vickers and Knoop. The Mohs scale is based on hardness in terms of which material can produce a scratch on another. The Vickers and Knoop scales are based on the use of a diamond to indent the tested material, either a metal (Vickers) or brittle material (Knoop), which needs to be measured without damage to either material. The highest values on any scale are for diamond, which has the maximum hardness.

This article describes an experiment which determines abrasive properties using diffraction to measure particle size distributions along with dynamic image analysis. The emphasis is on certain parameters used to calculate Krumbein Roundness in order to define the form and shape of the abrasive in terms of the particle sharpness.
Size Measurement
An abrasive is selected for a particular use based on particle size. While this was measured using sieves in the past, this technique cannot be used when the size is very small, and may be inaccurate when the shapes are irregular. Abrasives may vary in size from 6 microns to 6 mm. Special polishing abrasives require particle sizes less than 6 microns, in fact. The Sync device can measure anywhere from 0.020 to 4000 microns in a typical setup using dry powder configuration, while for fluids, the range extends over 0.020 to 2000 microns.
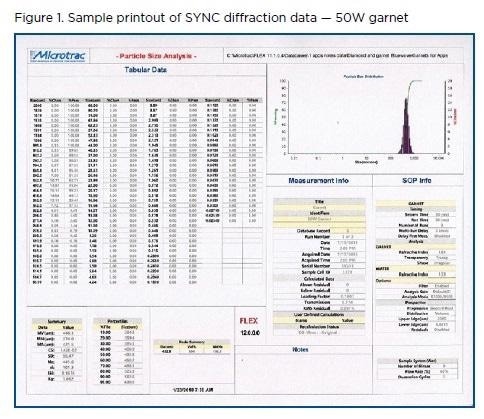
Diffraction has come into widespread use and is the go-to method for particle size distribution. This technology is rapid and robust, reflects changes accurately, and results in describing a wide set of characteristics that completely define the material properties. The figure below shows a typical readout of a Sync diffraction measurement performed on Garnet 50W from Barton Mines.
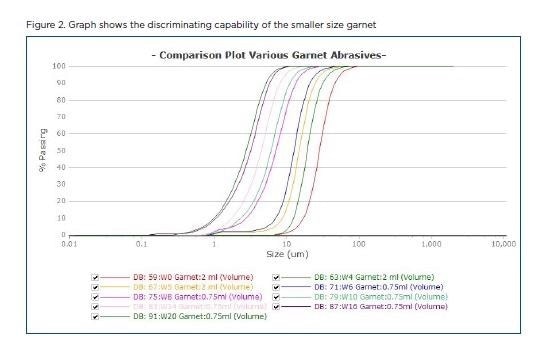
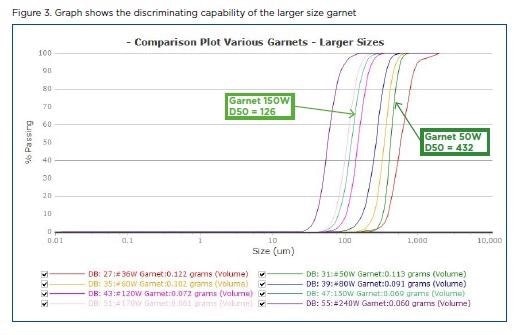
Graphical comparisons of garnet abrasives over a variety of sizes subjected to Microtrac MRB Sync diffraction measurement are shown in Figures 2 and 3. The graph plots were generated using the display features of Microtrac MRB FLEX software. The use of the percent passing data seen in the figures is to show the sensitivity and resolution capacity of this technology. All distributions are by volume distributions (weight/mass) because the density is constant for all particles.
Sharpness and Shape Indicators of Abrasives by Dynamic Image Analysis (DIA)
Particle shape and size are important, and indeed primary, determinants of abrasive effectiveness. One of the most important contributors to particle shape is sharpness, which indicates the capability of a material to rub off the surface of another material. The surface roughness or asperity influences how fast the surface being treated wears down and how effective the abrasive is. There is an established particle size effect by which the rate of wear drops steeply once the particle size of the abrasive falls below a critical limit. Sharpness is based upon the SPQ (spike Parameter Quadratic) calculation, as well as other methods dating back to older times.
In the past, abrasive capability was indicated by shape and angularity which were determined using microscopic and macroscopic images of the particles of the abrasive to a Krumbein chart, comparing the shapes and coming up with a total value which shows the overall shape characteristics. However, only a few particles can be manually analyzed in this manner, and statistical inaccuracy may be an issue in the final result. Figures 5 and 6 show a very similar shape for both Garnet 50W and Garnet 150W, which indicate that making decisions as to the shape and annularity of a material could well be difficult under such testing conditions.
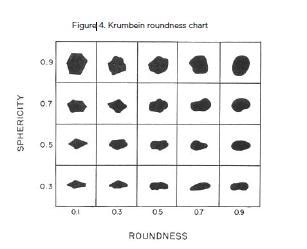
This visual chart is the Krumbein chart and is often used to match images for sand grains to estimate their roundness and sphericity (from Krumbein, W.C., and Sloss, L.L., Stratigraphy and Sedimentation, 1956, Freeman and Company, San Francisco CA)
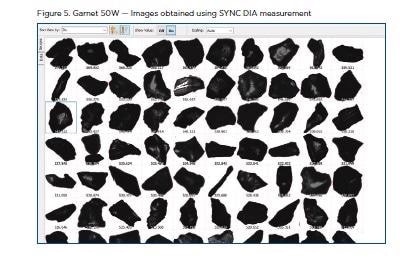
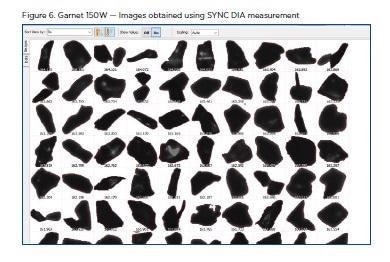
Image Analysis and Krumbein Calculations
Sync diffraction data for the same pair of garnet materials is shown above to reveal the size difference, and this is vital to allow proper abrasive selection and use. The knowledge of particle shape is equally important, as already explained. Thus, in modern testing the Krumbein chart may provide a foundation for particle size and shape determination, while DIA allows for a more detailed description and characterization of the abrasive for quality control purposes and with better statistical validity.
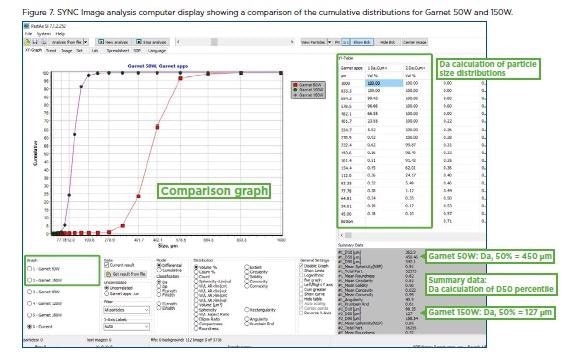
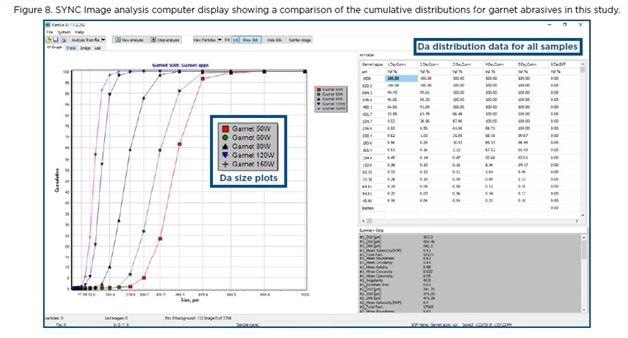
Figure 7 compares the data obtained by data analysis of garnet 50W and garnet 150W. The Da calculation indicates the reported sizes, which resemble those obtained by Sync laser diffraction (shown in Figures 2 and 3) very closely. Figure 8 shows comparison of size in terms of Da between five garnets studied in this experiment, and also the comparison between their size distributions as obtained by Krumbein chart matching, depicted in Figure 9.
The form factors that are generally adopted for particle characterization are compared to the Krumbein calculation. For any abrasive of any grade, the angularity is given by the Krumbein value which enables the grade of the material to be identified and characterized.
With the present device, the Microtrac MRB Sync, both DIA and laser diffraction are used to determine the size, which helps to decide if the abrasive should be used for polishing, water jetting or blasting. Once this grouping is accomplished, further differences depend on the type of material and they thus help identify and characterize the material with great sensitivity and accuracy.
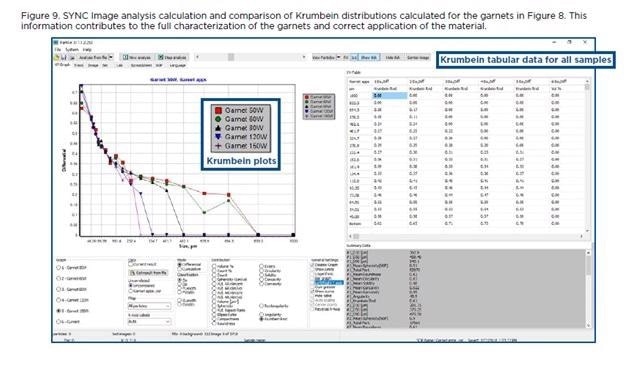
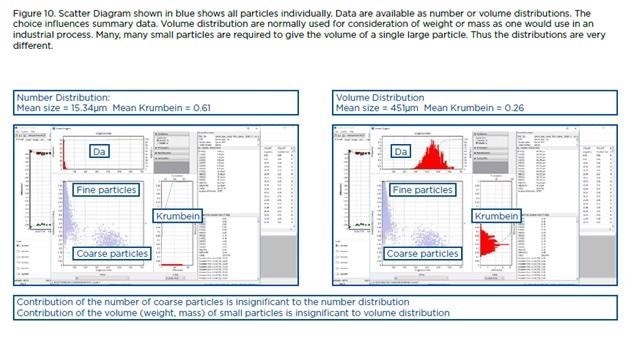
It is important to know the full range of particles present in a distribution so that the right type of distribution can be selected. In the current setup, the volume distribution is important to the application because all the materials are handled, the weight determined and the properties evaluated based on volume. Sieving of the material also uses weight as the basis for size/volume grouping of data. The number or count percentage is rarely used. Small particles are not usually independent, rather they were attached to the larger particles and detached during the course of sample preparation. The fines are generally the result of grinding and processing.
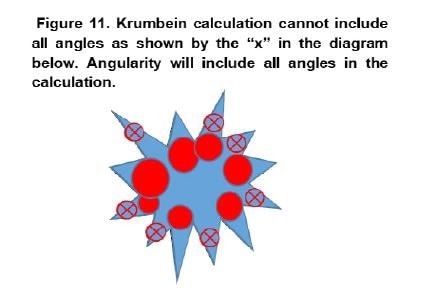
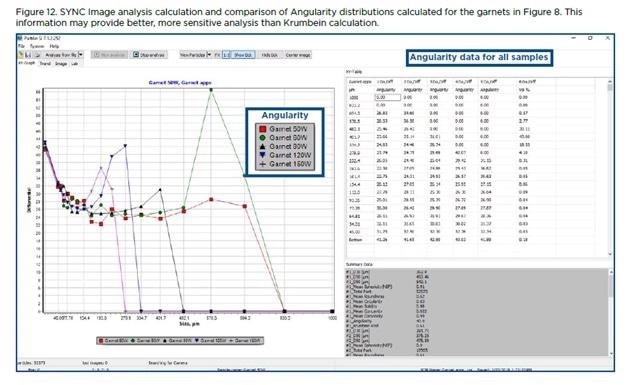
Rather than Krumbein parameters, the angularity of the particle be a more valid parameter of sharpness as shown in the image analysis graph plots below, as all the pointed edges of the particles are counted for angularity, compared to a limited approach with the Krumbein chart. This restriction is due to its failure to fit all the circles because it cannot show all angular sites. Both Krumbein and angularity data are shown to allow assessment of each trend. Though they show opposite trends, this is explained by the difference in the purpose and the methods of calculation of the two methods, which are therefore able to show different aspects of particle shapes.
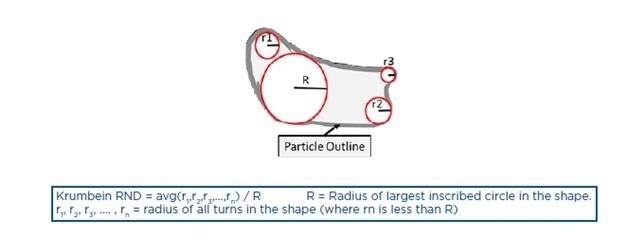
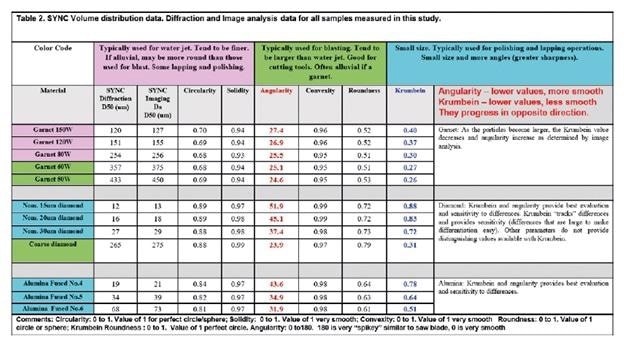
Roundness is another property of abrasive sharpness, but the table shows that it is not distinctive enough on diffraction data to separate the different abrasives sufficiently to allow easy characterization. Krumbein Roundness possesses increased sensitivity and discrimination with respect to separating the three materials (diamond, garnet and alumina), and in particular, diamond and alumina.
Table 2 gives data to show that combining diffraction measurements of particle size with image analysis gives a more detailed characterization of an abrasive, compared to the use of either size alone or size with the Krumbein chart matches. Other shapes and forms are also displayed for the sake of comparison.
While the other parameters may be useful in separating materials by angularity, the sensitivity of this approach is suboptimal for material discrimination, and may not be able to reveal angular shape differences in materials. The discrimination between materials may or may not be adequate in different situations depending on the degree of differentiation.
Summary
The determination of sharpness is a current topic of exploration in the study of abrasives. While a variety of methods may be used, many of them require too much time, are relatively insensitive or need overly elaborate sample preparation. The current experiment shows that diffraction measurements offer a satisfactory solution to get the data on particle sharpness, especially for abrasives, because for this class of materials this data is important for durability and effective abrasion.
Their use therefore allows specifications to be set and maintained, with Krumbein calculations being of additional value to process the information obtained through image analysis. The sharpness value also helps to complete the characterization of abrasive materials. The use of Sync diffraction measurements and automated image analysis thus permits both measurements to be carried out on the same sample, and ensures that the sample is representative, avoiding the issues that can arise when samples are tested by multiple instruments using separate technologies.
Some particles may be found to be as large as ¼ of an inch, which do not fall within the range of measurement of the Microtrac MRB Sync or any instrument that uses laser diffraction. These can be imaged using the Microtrac MRB range of imaging instruments that can measure particles up to 5 inches, using both in-line and laboratory samples, based on patented 3-dimensional imaging technology.

This information has been sourced, reviewed and adapted from materials provided by Microtrac MRB.
For more information on this source, please visit Microtrac MRB.