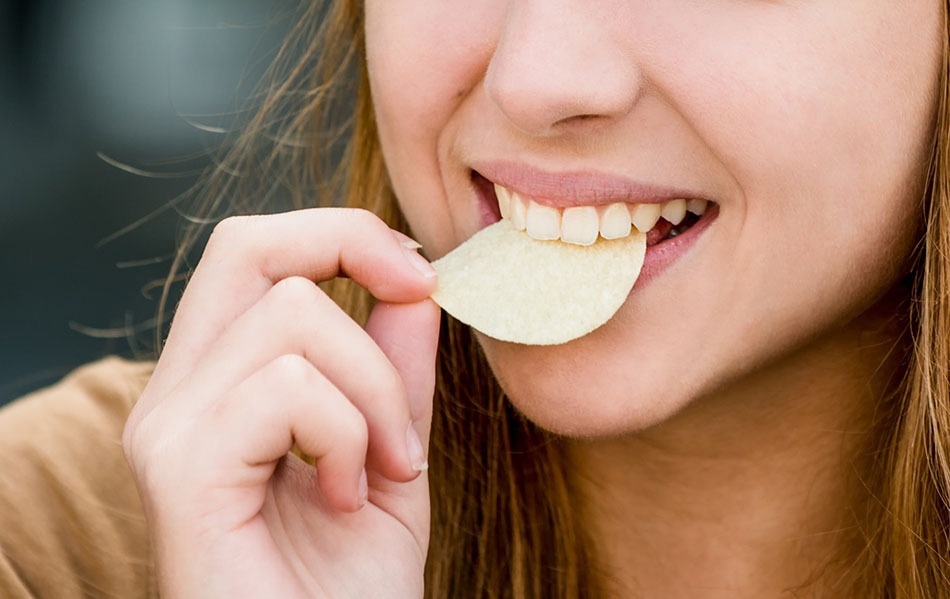
Whether it’s a heaping pile of pita chips, a crisp apple, or a fresh cucumber salad, people can’t seem to get enough of crispy, crunchy textures. A crispy texture is highly desirable in snack foods because it provides a satisfying sensory experience. The crispiness creates a distinct sound when the snack is bitten or chewed, making the overall experience more interesting and enjoyable.

Image Credit: Stable Micro Systems Ltd
From a scientific perspective, the crispy texture of snack foods is caused by the rapid evaporation of moisture when the food is fried or baked. This results in a dehydrated and porous structure, which creates the characteristic crunchiness. The crispy texture can also help to enhance the flavour of the snack by increasing the surface area of the food that comes into contact with the taste buds.
The sound made while eating crisp baked items like wafers is crucial to gaining customer approval. This is due to the fact that acoustics and the perception of product quality and even flavour are strongly related. Turning up the volume on product crunchiness may help food manufacturers win over devoted customers who believe that crisps that crunch louder taste fresher. However, you must support your textural claims with accurate, precise measurements if you want to present them on your packaging, such as "50% more crunch."
How to Measure and Optimise Your Crunch?
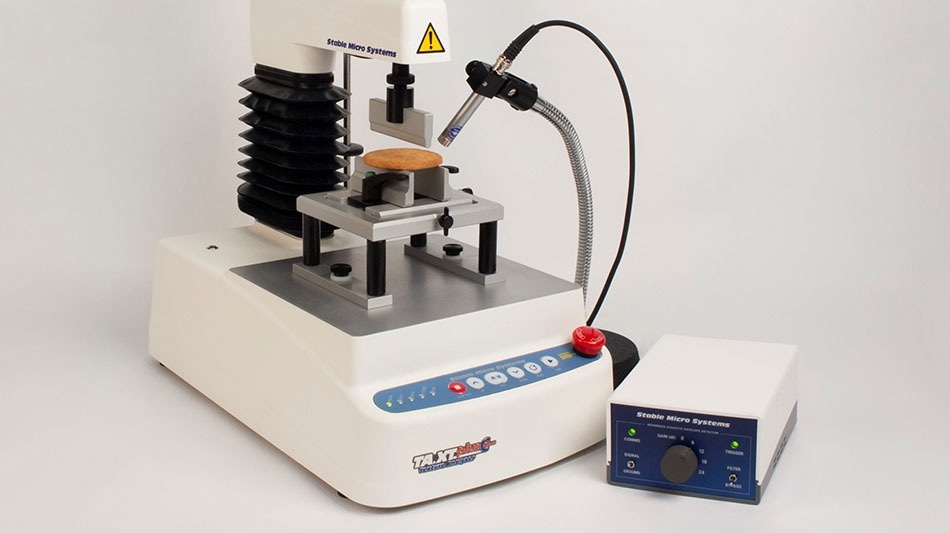
But how do you know when you’ve hit the ideal crunch volume? One way is to use a trained tasting panel to determine whether the crunch is loud enough. Another, more repeatable, reliable and scientific approach is to use a TA.XTplusC/TA.HDplusC Texture Analyser – an instrument which measures and quantifies sensory attributes/properties of a product by capturing force, distance and time data at a rate of up to 2000 points per second.
One example manufacturer is Omya – see how Omya used their Texture Analyser and Acoustic Envelope Detector in the development of their crispier creations.
If a product developer wanted to make their product crunch louder, they would simply put the product under the Texture Analyser on an appropriate fixture – so, for a biscuit, they would use a three-point-bending rig. They would then position the microphone 1 centimetre from where the biscuits were going to fracture. The acoustic data would then be captured throughout the breaking of the biscuit and would be presented graphically, as a jagged line with some taller peaks.
To make a louder product you would be looking for the product that generates the highest ‘peaks’ or decibel values, so tall peaks rather than lots of little ones. If a manufacturer wants to compare how crispy different products are, they can count the number of peaks generated and divide this by the number of seconds over which they occur. This will tell how many fractures are produced in a second – and the more there are, the crispier the product.
These examples will help you understand how the product is measured and how the sound is collected:
Measure sound with an Acoustic Envelope Detector - Cracker snap on a 3 point bend
Video Credit: Stable Micro Systems Ltd
Measure sound with an Acoustic Envelope Detector - Crisp fracture
Video Credit: Stable Micro Systems Ltd
Measure sound with an Acoustic Envelope Detector - Popcorn compression
Video Credit: Stable Micro Systems Ltd
Measure sound with an Acoustic Envelope Detector - Cornflakes bulk compression
Video Credit: Stable Micro Systems Ltd
Selling ‘Texture’ of Your Product
As demonstrated in the examples above, acoustic data may be measured and displayed in Exponent Connect software in real time alongside mechanical measures (force, distance, and time) to help identify specific test events and provide a fourth dimension to texture analysis. You may quantify other sounds, such as the fizz a bath bomb makes as it dissolves or the popping of a beverage can. This sound measurement offers an additional level of quantitative information on fractures or other audible events that take place when a sample deforms during testing.
Pioneers in Measuring Food Acoustics
In the academic world, these papers have been recently published that use the Texture Analyser and Acoustic Envelope Detector in the snack food field.
Acoustic settings combination as a sensory crispness indicator of dry crispy food
Acoustic, mechanical and microstructural properties of extruded crisp bread
Quick assessment of the potato chip crispness using the mechanical-acoustic measurement method
Assessment of acoustic-mechanical measurements for texture of French fries: Comparison of deep-fat frying and air frying
Texture of extruded breakfast cereals: Effects of adding milk on the texture properties and on the correlations between instrumental and sensory analyses

Image Credit: Stable Micro Systems Ltd
Who’s Been Using the Acoustic Envelope Detector Already?
The Texture Analyser is already a known tool in Quality Control and Assurance in the Snack Food Industry. The Acoustic Envelope Detector has been around since 2009 and in this time has been used in several patents (including one by Intercontinental Great Brands for designing confectionery having two kinds of texture) and extensively in published papers as a valuable addition to characterising products in this novel way.
Get a run through of all Google Scholar articles that include the use of this product
Read our blog article about measuring the sound of popping candy
Want to Know More About Measuring Sound?
To get the competitive edge, you’ll need the tools to measure the results of your crispy/crunchy product development – a Texture Analyser attached to an Acoustic Envelope Detector is the solution when you’re ready to quantify your claims.
Visit the Acoustic Envelope Detector page for more detailed product information
Request an Acoustic Envelope Detector brochure

This information has been sourced, reviewed and adapted from materials provided by Stable Micro Systems Ltd.
For more information on this source, please visit Stable Micro Systems Ltd.