The legalization of the recreational and medicinal use of cannabis across more jurisdictions in the US means that there is an increase in the use of pesticides for the cultivation of Cannabis.
Image Credit: Michael Nosek/Shutterstock
Due to the fact that certain pesticide residues present significant health risks to consumers, pesticide analysis of cannabis in California is greatly regulated by the Bureau of Cannabis Control (BCC). Every single legal Cannabis product sold in California is subject to analysis for sixty-six regulated pesticides.
Depending on their classification and potential danger to human health, the action limits of these pesticides can widely differ. The extracted Cannabis matrix is infamously difficult to work with as there are considerable interferences present which impede the low-level detection of pesticides.
This study presents an overview of an extensive method for the analysis of gas chromatograph (GC)-amendable pesticides in the Cannabis flower. This method utilizes dispersive solid-phase extraction (dSPE) to assist with the mitigation of matrix effects that are frequently found in the flower’s extract.
For each target pesticide, three selected reaction monitoring (SRM) transitions were employed. The focus of this study was geared towards developing a sturdy and sensitive method for GC amendable pesticides in Cannabis flower for use in California State. Accordingly, C-MS/MS would also be necessary to analyze the entire California pesticide list.
Experimental
For sample preparation, the Cannabis flower was ground and extracted with the application of a mixture of acetonitrile and dimethylacetamide (DMA). Spiking of the sample was conducted by applying a standard mixture 20 ppb pesticide consisting of the 12 compounds as listed in Table 3.
The extraction and dSPE workflow are detailed in Figure 1. The use of dSPE is key for the reduction of matrix effects and facilitating low detection limits, as illustrated in Figure 2.
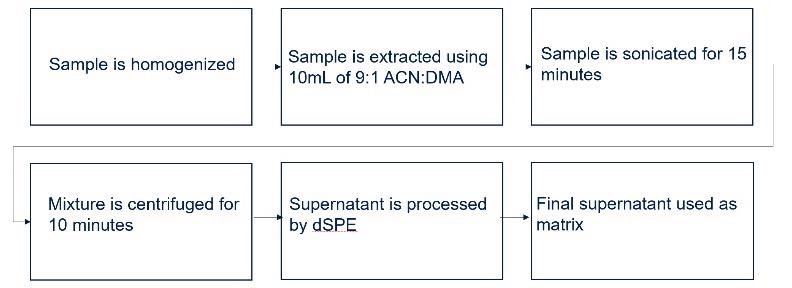
Figure 1. Sample preparation of Cannabis flower. Image Credit: Think20 Laboratories, Irvine, CA - JEOL USA, Inc. Peabody, MA
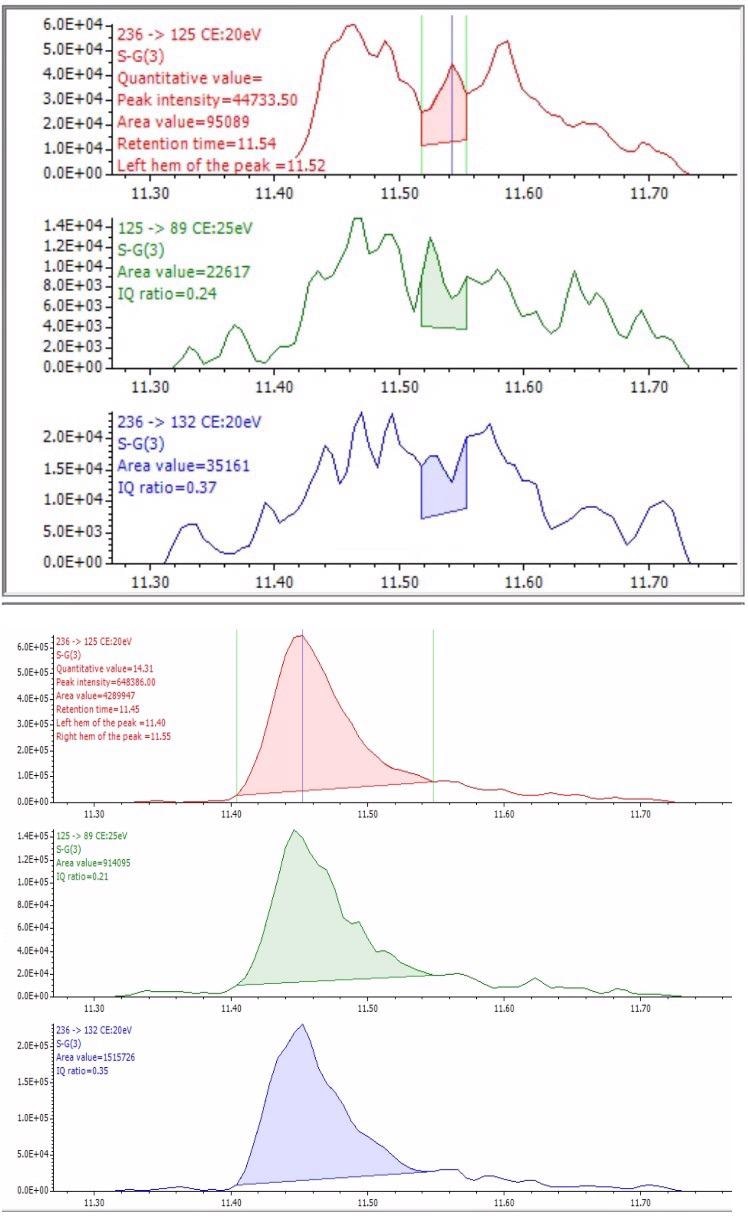
Figure 2. Cannabis matrix effects before (top) and after (bottom) using dSPE. Image Credit: Think20 Laboratories, Irvine, CA - JEOL USA, Inc. Peabody, MA
The instrumentation for the experiment included an Agilent 7890B GC in conjunction with a JEOL JMS-TQ4000GC triple quadrupole mass spectrometer. All injections were performed utilizing pulsed splitless liquid injection. Analysis parameters and SRM channels are described in Tables 1–3.
Table 1. Gas Chromatograph Parameters. Source: Image Credit: Think20 Laboratories, Irvine, CA - JEOL USA, Inc. Peabody, MA
| . |
. |
| GC |
7890B (Agilent) |
| Column |
ZB-5MSPlus, 30.0 m, 0.25 mm i.d., 0.25 µm (Phenomenex, Cat#:7HG-G030-11) |
| Inlet liner |
Zebron Plus 4 mm Single Taper w/Wool on bottom (Phenomenex Cat#: AG2-0A11-05) |
| Inlet Temp. |
260 °C |
| Carrier Gas Type, Flow |
He, 1.000 mL/min constant flow |
| Mode |
Pulsed Splitless |
| Pulsed Pressure, Time |
206.84 kPa, 0.550 min |
| Purge Flow |
30 mL/min, 1.0 min |
| Septum Purge Flow |
3.0 mL/min |
| Saver flow, Time |
15 mL/min, 5.0 min |
| Injection Volume |
1.0 µL |
| Oven Program |
80 °C (0.75 min) → 35 °C/min → 190 °C → 5 °C/min → 240 °C → 20 °C/min → 300 °C (6 min) |
Table 2. Mass Spectrometer Parameters. Source: Think20 Laboratories, Irvine, CA - JEOL USA, Inc. Peabody, MA
| JMS-TQ4000GC |
| Ion Source Temp. |
250 °C |
| Interface Temp. |
300 °C |
| Ionization Mode |
EI+, 70 eV, 100 µA |
| Measurement Mode |
SRM, High Sensitivity |
| Target Cycle Time |
Approx. 330 ms |
| Acquisition Rate |
2.778 Hz |
| Channel Time |
20 – 100 ms |
| Relative EM Voltage |
900 V |
| Collision Gas |
N2, 10% |
Table 3. SRM Transitions. Source: Think20 Laboratories, Irvine, CA - JEOL USA, Inc. Peabody, MA
| Analyte |
AnalytePrecursor |
Collision Energy |
Product |
| Boscalid |
140 |
10 |
12 |
| 140 |
25 |
76 |
| 342 |
20 |
140 |
| Cis-Chlordane |
375 |
20 |
266 |
| 373 |
25 |
266 |
| 373 |
25 |
264 |
| Trans-Chlordane |
373 |
25 |
266 |
| 373 |
20 |
264 |
| 375 |
20 |
266 |
| Chlorfenapyr |
59 |
5 |
31 |
| 247 |
15 |
227 |
| 59 |
5 |
41 |
| Fipronil |
213 |
25 |
143 |
| 367 |
30 |
213 |
| 213 |
20 |
178 |
| Kresoxim-methyl |
116 |
20 |
89 |
| 206 |
10 |
116 |
| 206 |
10 |
131 |
| Methiocarb |
168 |
10 |
153 |
| 168 |
15 |
109 |
| 153 |
10 |
109 |
| Propoxur |
110 |
25 |
63 |
| 152 |
10 |
110 |
| 110 |
20 |
64 |
| Chlorpyifos |
197 |
15 |
169 |
| 1991 |
15 |
171 |
| 197 |
25 |
134 |
| Diazinone |
137 |
15 |
84 |
| 199 |
10 |
135 |
| 199 |
15 |
93 |
| Dimethoate |
93 |
10 |
63 |
| 87 |
10 |
42 |
| 87 |
20 |
46 |
| PCNB |
295 |
15 |
237 |
| 249 |
15 |
214 |
| 237 |
20 |
119 |
Results
The SRM chromatograms for the three transitions of every single pesticide tested are displayed in Figures 3 through 14. For all pesticide transitions at 20 ppb, strong signals were seen with limited interference effects.
These results clearly demonstrate that this extraction/dSPE method used in conjunction with GC-MS/MS can easily handle the action limits for GC amenable pesticides as determined by California State regulations.
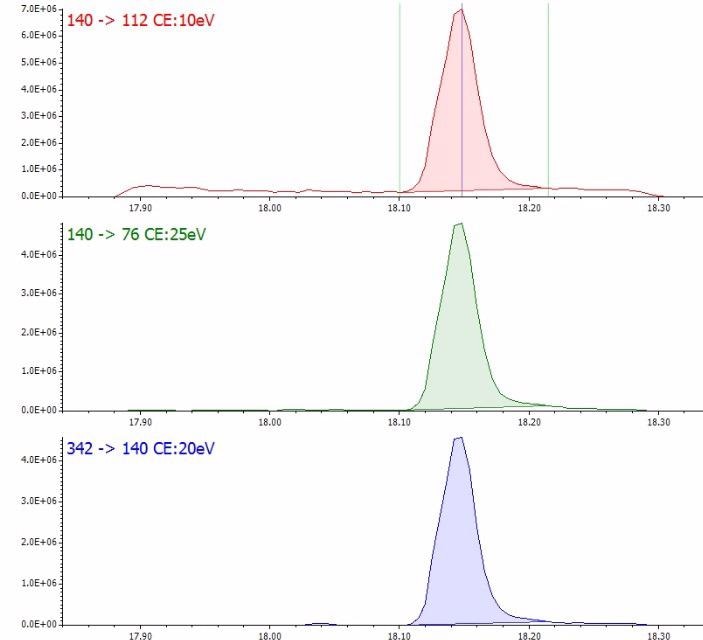
Figure 3. SRM chromatograms for boscalid. Image Credit: Image Credit: Think20 Laboratories, Irvine, CA - JEOL USA, Inc. Peabody, MA
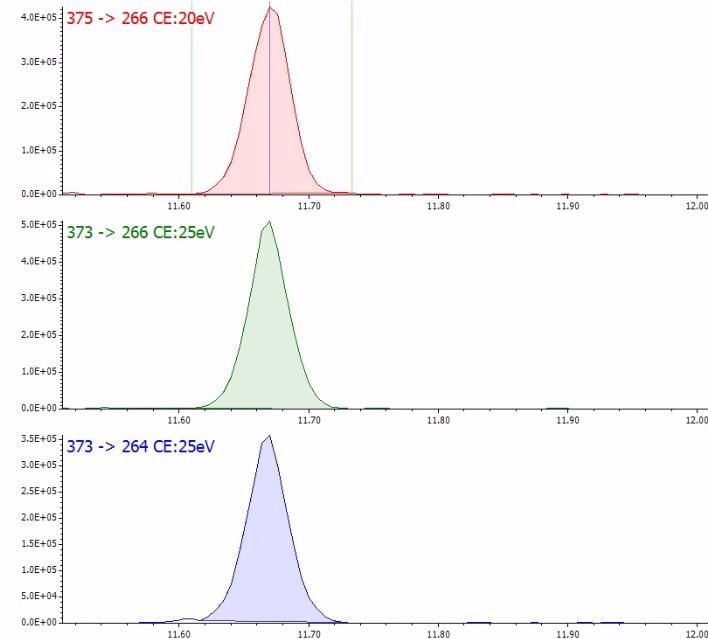
Figure 4. SRM chromatograms for cis-chlordane. Image Credit: Image Credit: Think20 Laboratories, Irvine, CA - JEOL USA, Inc. Peabody, MA
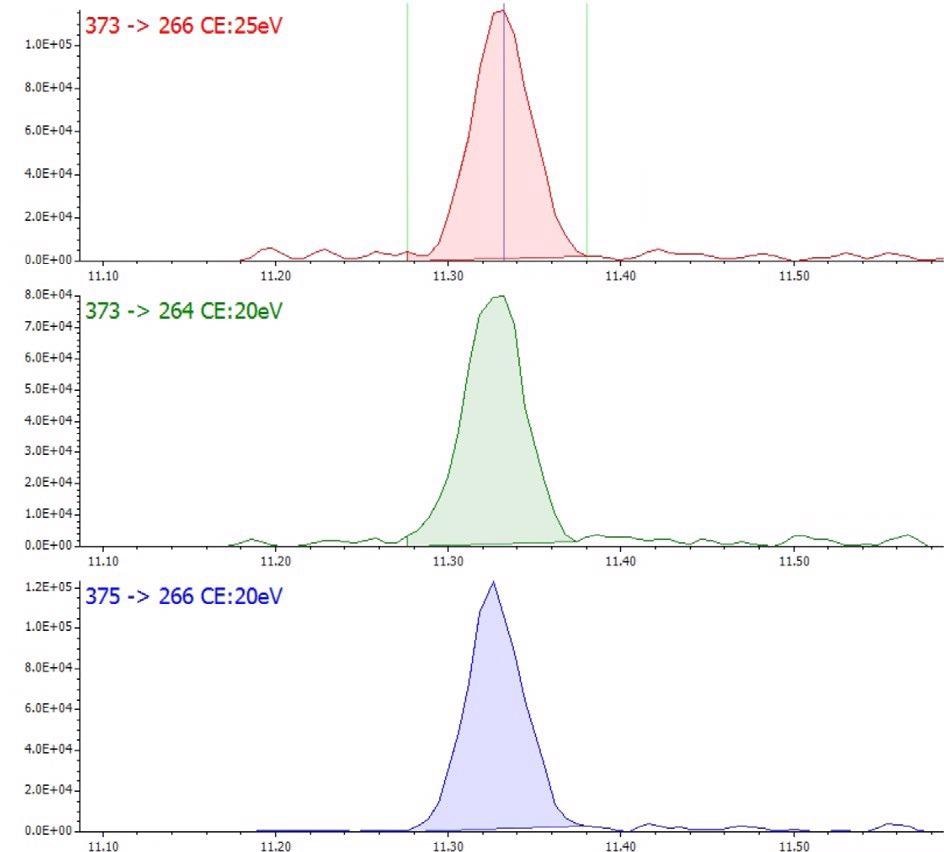
Figure 5. SRM chromatograms for trans-chlordane. Image Credit: Think20 Laboratories, Irvine, CA - JEOL USA, Inc. Peabody, MA
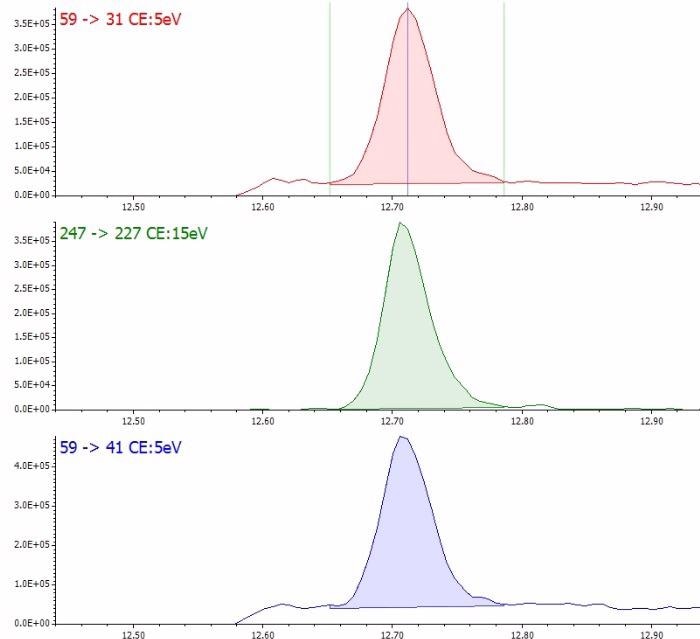
Figure 6. SRM chromatograms for chlorfenapyr. Image Credit: Think20 Laboratories, Irvine, CA - JEOL USA, Inc. Peabody, MA
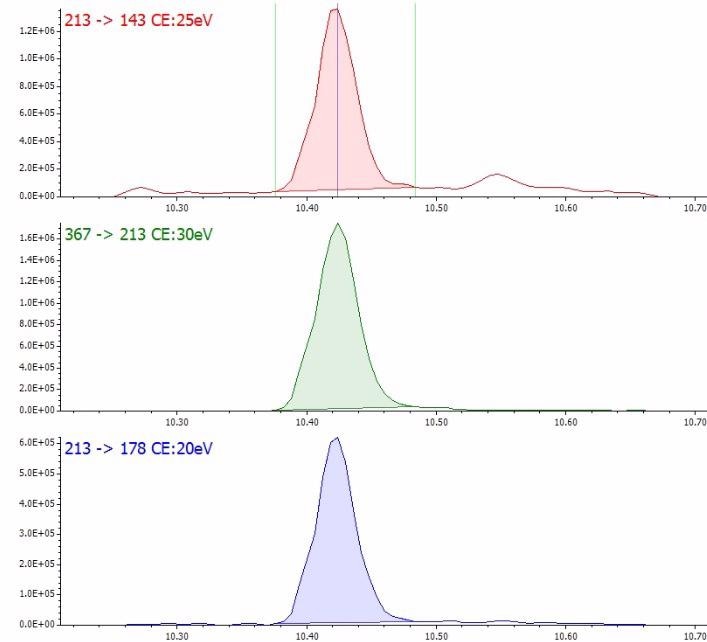
Figure 7. SRM chromatograms for fipronil. Image Credit: Think20 Laboratories, Irvine, CA - JEOL USA, Inc. Peabody, MA.
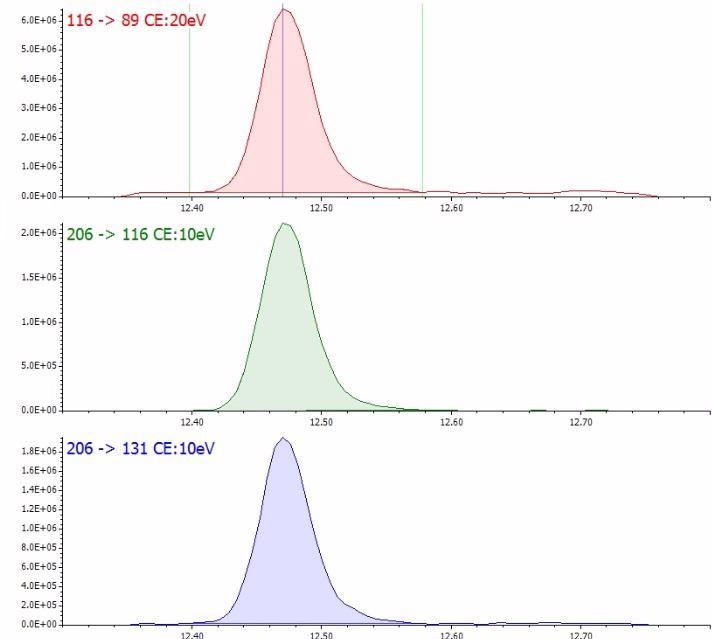
Figure 8. SRM chromatograms for kresoxim-methyl. Image Credit: Think20 Laboratories, Irvine, CA - JEOL USA, Inc. Peabody, MA
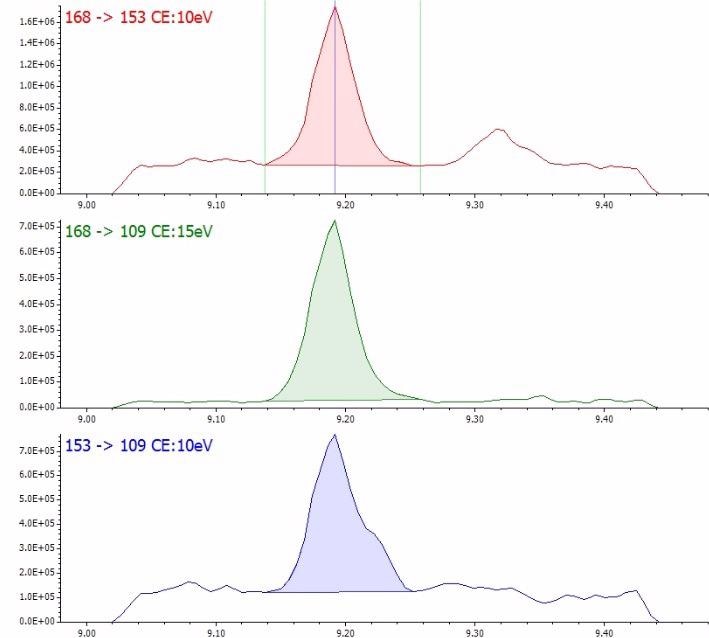
Figure 9. SRM chromatograms for methiocarb. Image Credit: Think20 Laboratories, Irvine, CA - JEOL USA, Inc. Peabody, MA
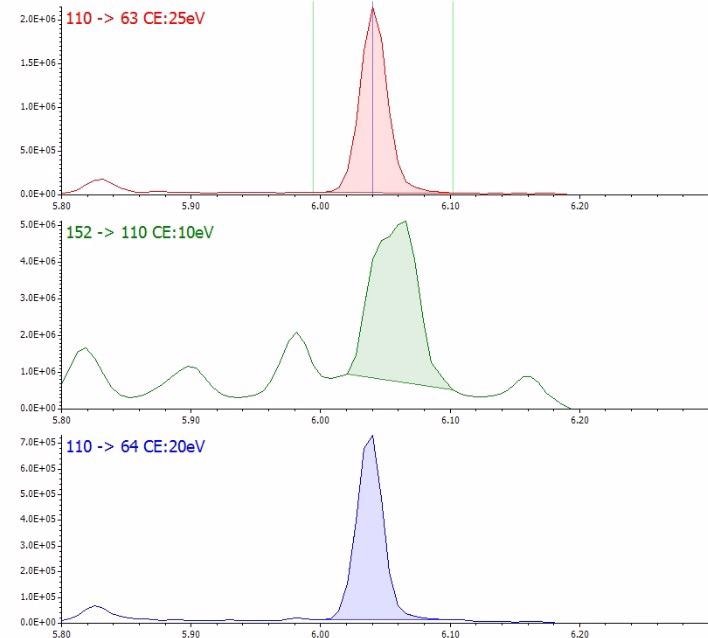
Figure 10. SRM chromatograms for propoxur. Image Credit: Think20 Laboratories, Irvine, CA - JEOL USA, Inc. Peabody, MA
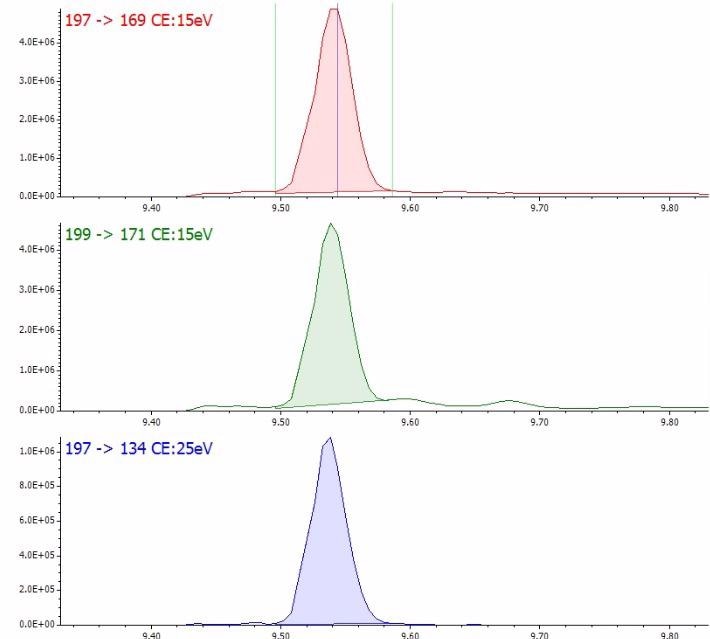
Figure 11. SRM chromatograms for chlorpyrifos. Think20 Laboratories, Irvine, CA - JEOL USA, Inc. Peabody, MA
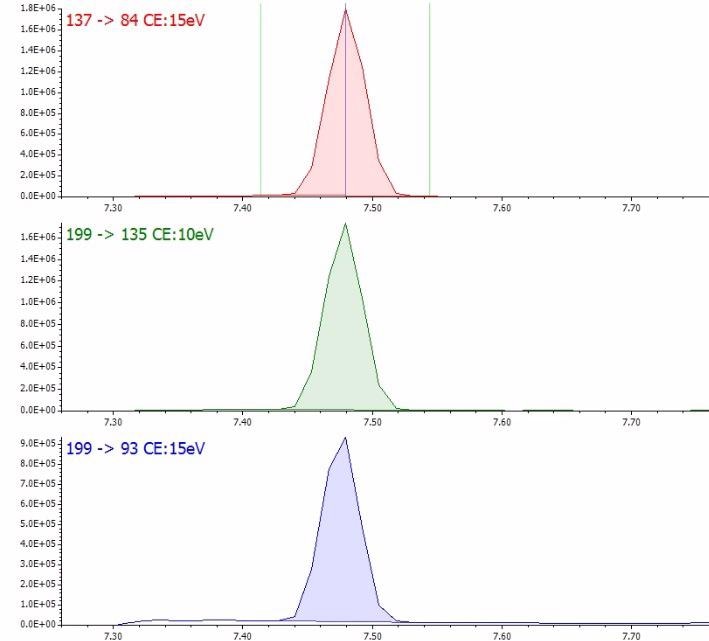
Figure 12. SRM chromatograms for diazinone. Image Credit: Think20 Laboratories, Irvine, CA - JEOL USA, Inc. Peabody, MA
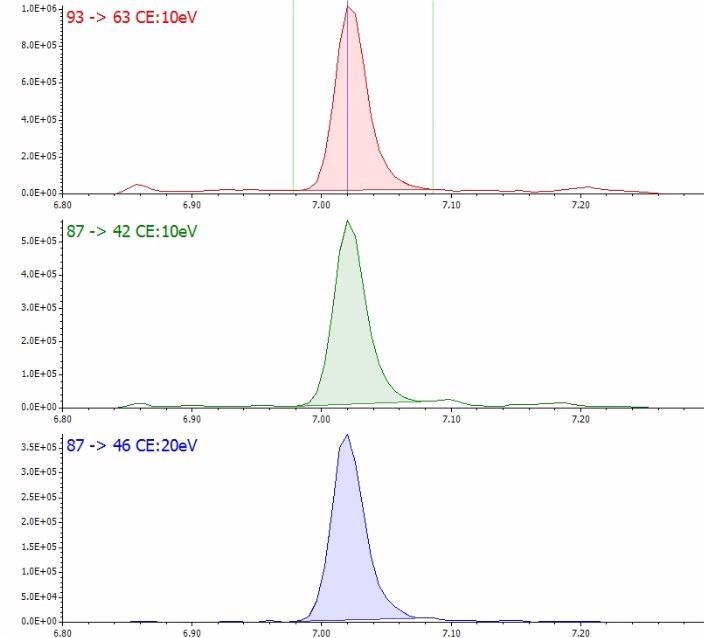
Figure 13. SRM chromatograms for dimethoate. Image Credit: Think20 Laboratories, Irvine, CA - JEOL USA, Inc. Peabody, MA
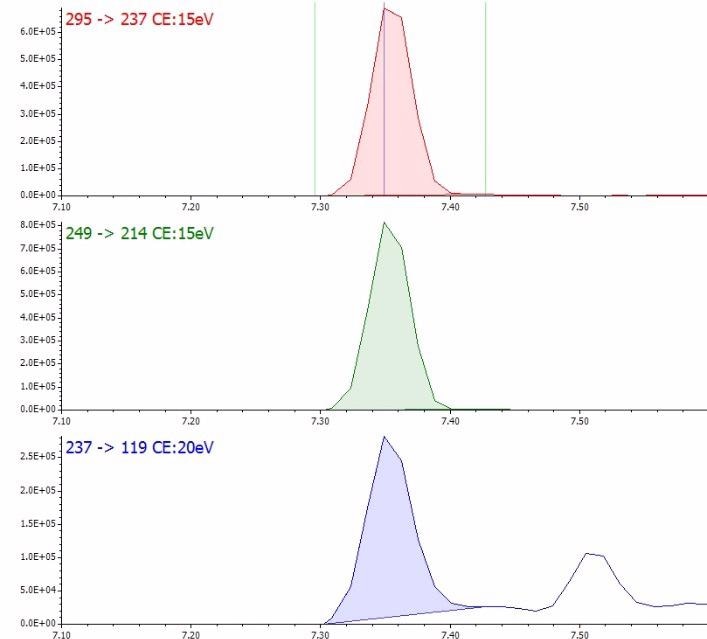
Figure 14. SRM chromatograms for pentachloro-nitrobenzene (PCNB). Image Credit: Think20 Laboratories, Irvine, CA - JEOL USA, Inc. Peabody, MA
Conclusions
This study platforms an effective method that is sensitive and rapid enough for the testing of GC amenable pesticides in the cannabis matrix.
Utilizing a dSPE sample cleanup step combined with GC-MS/MS enables the high-speed selective screening of Cannabis products.
What is more, using this framework achieved low detection limits, which subsequently enables greater dilution factors to continually mitigate matrix effects.
Using dSPE also facilitated increased sensitivity and enhanced chromatographic peak shapes by eliminating interference compounds. These results demonstrate that the action limits set by the State of California are readily achievable using this method as each pesticide can be measured at 20 ppb in the cannabis matrix.
Additionally, an amalgamation of GC-MS/MS and LC-MS/MS will supply the best all-around capabilities for a complete analysis of the entire California pesticide list.

This information has been sourced, reviewed and adapted from materials provided by JEOL USA, Inc.
For more information on this source, please visit JEOL USA, Inc.