Lithium (Li) is found in almost every facet of modern life, often playing a vital role in essential items such as batteries. Lithium batteries are frequently found in computers, cell phones, electric vehicles and virtually every type of portable electronic device.
Over the past decade, advances in lithium battery technology have been driven by consumer demand for longer battery lives and increasingly rapid charging capabilities.
The global shift towards renewable energy, electrification and the growing popularity of electric vehicles are contributing to the demand for batteries with higher capacities and lithium-based materials with more stringent quality control (QC) requirements.
Battery production technology needs to be improved to meet these demands, requiring enhanced control of raw materials and their physical properties.
For example, lithium salts are generally refined from brine, which is comprised of concentrated NaCl solution. During the extraction process, it is necessary to remove sodium from the final product because the presence of excess sodium may cause overheating in the battery end products.
Therefore, it is vital that manufacturers can identify the presence of impurities in lithium battery materials to ensure that there is no compromise in final battery performance.
ICP-OES is currently the most commonly employed method for analyzing Li salt compounds for purity. However, a limited number of elements are measured due to the inherent sensitivity limitations of ICP-OES.
The industry is demanding better-performing batteries with a longer lifetime, which in turn calls for the use of higher-purity raw materials.
While there is currently no industry standard for the purity of Li salts used in battery production, manufacturer-led purity requirements have risen from 99% to 99.9% over the past few years.
This increase is expected to continue in the future, with high-grade battery manufacturers set to want 99.95-99.99% purity in the coming years as demand for lithium batteries increases.
This surge in demand will have a considerable impact on the analysis of raw materials, increasing the number of elements requiring analysis and the need to accurately measure lower levels of impurities.
The analysis of impurities will be forced to move from ICP-OES to the use of ICP-MS or multi-quadrupole ICP-MS.
This article explores such a shift, outlining the analysis of four lithium salts using PerkinElmer’s NexION® 5000 multi-quadruple ICP-MS instrument.
Experimental
Samples and Sample Preparation
Four different lithium salts were analyzed, as per Table 1: 98% LiOH, 99.95% LiOH, 99% Li2CO3 and 99.998% Li2CO3 (VWR International, Radnor, Pennsylvania, USA).
Table 1. Lithium salts analyzed. Source: PerkinElmer
| Sample |
Purity % |
| LiOH |
98
99.95 |
| Li2CO3 |
99
99.998 |
To prepare the samples, 250 mg of each salt was weighed out and combined with 50 mL 1% nitric acid (v/v). Samples were permitted to degas for 1 hour prior to being diluted 100x with 1% nitric acid for analysis.
Each of the samples was prepared in triplicate to evaluate the instrument and method’s robustness and reproducibility.
Care was taken to minimize static charge when handling samples. This was done by remaining grounded and discharging to a conductive material prior to handling.
Measurements were performed against external calibration curves. Standards were prepared in 1% nitric acid.
Instrumental Conditions
The NexION 5000 ICP-MS multi-quadrupole based system was employed in all analyses. A number of the instrument’s key features were used:
- Universal Cell technology1 - including optional Reaction, Collision and Standard modes
- All Matrix Solution (AMS) – an on-line Ar dilution system2
- Extended Dynamic Range (EDR) - the NexION’s Universal Cell offers this unique capability which enables the electronic dilution of target elements with no increase in analysis time or impact on the sensitivity of other elements
- OmniRing technology - part of the second-generation Triple Cone Interface (TCI) which has been optimized to improve sensitivity and offer the lowest BECs for the MS/MS and Mass Shift modes of operation
The NexION 5000 ICP-MS was set up to use a High Throughput System (HTS) – an innovative valve-and-loop system designed to minimize sample uptake and washout times. An S23 autosampler was also used to enable automated sample introduction.
Table 2 displays the conditions of the NexION 5000 ICP-MS and HTS system, while Table 3 displays the modes of operation for each element.
Table 2. NexION 5000 ICP-MS instrumental conditions. Source: PerkinElmer
| |
Parameter |
Value |
NexION 5000
ICP-MS |
Plasma Flow |
16 L/min |
| Auxiliary Flow |
1.2 L/min |
| RF Power |
1600 W |
| Nebulizer |
PFA |
| Nebulizer Gas Flow |
0.84 L/min |
| AMS Gas Flow |
0.2 L/min |
| Spray Chamber |
SilQ cyclonic |
| Injector/Torch |
SilQ one-piece torch with 2 mm injector |
| Pump Tubing - Carrier |
Green/orange |
| Pump Tubing - IS |
Orange/blue |
| Cones |
Pt (sampler & skimmer), Hyper-skimmer with OmniRing used in focusing mode |
| Analysis Modes |
Standard, Reaction, MS/MS, Mass Shift |
High Throughput
System |
Loop Size |
2 mL |
| Loop Fill Time |
8 s |
| Wash Time |
15 s |
| Carrier Flow Rate |
0.164 mL/min |
Table 3. Elements, analytical masses, and modes of operation. Source: PerkinElmer
| Analyte |
Scan Type |
Cell Mode |
Q1 (amu) |
Q3 (amu) |
| Li |
MS/MS |
Standard |
6 |
6 |
| B |
MS/MS |
Standard |
11 |
11 |
| Na |
MS/MS |
Reaction NH3 |
23 |
23 |
| Mg |
MS/MS |
Reaction NH3 |
24 |
24 |
| Al |
MS/MS |
Reaction NH3 |
27 |
27 |
| Si |
MS/MS |
Reaction NH3 |
28 |
28 |
| P |
Mass Shift |
Reaction O2 |
31 |
47 |
| S |
Mass Shift |
Reaction O2 |
32 |
48 |
| K |
MS/MS |
Reaction NH3 |
39 |
39 |
| Ca |
MS/MS |
Reaction NH3 |
40 |
40 |
| Sc |
Mass Shift |
Reaction O2 |
45 |
61 |
| Ti |
Mass Shift |
Reaction O2 |
48 |
64 |
| V |
MS/MS |
Reaction NH3 |
51 |
51 |
| Cr |
MS/MS |
Reaction NH3 |
52 |
52 |
| Mn |
MS/MS |
Reaction NH3 |
55 |
55 |
| Fe |
MS/MS |
Reaction NH3 |
56 |
56 |
| Co |
MS/MS |
Reaction NH3 |
59 |
59 |
| Ni |
MS/MS |
Reaction NH3 |
60 |
60 |
| Cu |
MS/MS |
Reaction NH3 |
63 |
63 |
| Zn |
MS/MS |
Reaction NH3 |
66 |
66 |
| As |
Mass Shift |
Reaction O2 |
75 |
91 |
| Se |
Mass Shift |
Reaction O2 |
80 |
96 |
| Rb |
MS/MS |
Reaction NH3 |
85 |
85 |
| Sr |
MS/MS |
Reaction NH3 |
88 |
88 |
| Y |
Mass Shift |
Reaction O2 |
89 |
105 |
| Zr |
Mass Shift |
Reaction O2 |
90 |
106 |
| Mo |
MS/MS |
Standard |
95 |
95 |
| Ag |
MS/MS |
Standard |
107 |
107 |
| Cd |
MS/MS |
Standard |
111 |
111 |
| Sn |
MS/MS |
Standard |
118 |
118 |
| Sb |
MS/MS |
Standard |
121 |
121 |
| Cs |
MS/MS |
Standard |
133 |
133 |
| Ba |
MS/MS |
Standard |
137 |
137 |
| La |
Mass Shift |
Reaction O2 |
139 |
155 |
| Ce |
Mass Shift |
Reaction O2 |
140 |
156 |
| Pr |
Mass Shift |
Reaction O2 |
141 |
157 |
| Nd |
Mass Shift |
Reaction O2 |
146 |
162 |
| Sm |
Mass Shift |
Reaction O2 |
147 |
163 |
| Eu |
MS/MS |
Standard |
153 |
153 |
| Gd |
Mass Shift |
Reaction O2 |
157 |
173 |
| Tb |
Mass Shift |
Reaction O2 |
159 |
175 |
| Dy |
Mass Shift |
Reaction O2 |
163 |
179 |
| Ho |
Mass Shift |
Reaction O2 |
165 |
181 |
| Er |
Mass Shift |
Reaction O2 |
166 |
182 |
| Tm |
Mass Shift |
Reaction O2 |
169 |
185 |
| Yb |
MS/MS |
Reaction NH3 |
174 |
174 |
| Lu |
Mass Shift |
Reaction O2 |
175 |
191 |
| Au |
MS/MS |
Standard |
197 |
197 |
| Pb |
MS/MS |
Standard |
208 |
208 |
| Bi |
MS/MS |
Standard |
209 |
209 |
| U |
MS/MS |
Standard |
238 |
238 |
Results and Discussion
It is often necessary to measure both the major/matrix elements and impurities during the analysis of high-purity materials. This approach was used in this study, but a number of analytical challenges must be overcome when looking to measure both major and minor elements.
It is often challenging to measure a major element within a solution (such as Li) because the concentration is high compared to any trace elements present, prompting analysis without dilution to cause saturation or a heavy load on the detector.
It may even be necessary to analyze the sample twice at two different concentrations: one to measure trace elements and the other to measure major components.
The NexION series ICP-MS instruments mitigate the need for this additional analysis, however, as the signal of user-selected masses can be selectively attenuated in the Universal Cell using RPa (rejection parameter a).
No additional analysis time is required to employ RPa, and this can be applied to a single mass with no impact on other masses in the method or need to use an extra internal standard.
In the study presented here, RPa was optimized for 6Li and 7Li, at 0.015 and 0.1, respectively. This helped to ensure that all analytes in all standards and samples could be measured on the same detector stage.
Table 4 displays lithium results from three distinct lithium carbonate sample preparations. Mean results from the three samples fall within 0.1% for 6Li and 7Li, confidently verifying the methodology’s accuracy.
Table 4. Results from analysis of three separate preparations of lithium carbonate (99.998%). Source: PerkinElmer
Sample
Number |
6Li
Lithium Carbonate (%) |
7Li
Lithium Carbonate (%) |
| 1 |
19.00 |
18.64 |
| 2 |
18.31 |
18.88 |
| 3 |
18.53 |
18.61 |
| Mean |
18.61 |
18.71 |
| STD |
0.35 |
0.15 |
| RSD |
1.89 |
0.80 |
A difference of 0.1% corresponds to 1 mg out of a 250 mg sample size. However, care must be taken with weighing the samples to minimize static electricity during sample weighing and transfer. This is essential in attaining accurate, reproducible results.
With the accuracy of Li analysis established, it was then possible to conduct impurity measurements for the four different samples.
The industry has historically required a Li salt to be about 99% pure, using ICP-OES to measure impurity levels. Elemental analysis was therefore limited to a small number of elements: Al, Ca, Cr, Cu, Fe, K, Mg, Mn, Na, Pb and Zn.
As purity requirements are becoming increasingly stringent, battery manufacturers are now opting to use compounds with 99.9-99.95% purity and a more comprehensive list of elements that require detection and measurement.
Table 5 displays impurity concentrations in four different Li salts, including the total impurity level and corresponding impurity concentrations.
Table 5. Impurities in Li salts. Source: PerkinElmer
| |
Impurity (μg/g) |
| Analyte |
MDL |
LiOH 98% |
LiOH 99.995% |
Li2CO3 99% |
Li2CO3 99.998% |
| B |
0.03038 |
< MDL |
< MDL |
4.0205 |
1.0651 |
| Na |
0.07752 |
524.9767 |
8.4421 |
182.8105 |
1.5979 |
| Mg |
0.00158 |
0.7179 |
< MDL |
78.1201 |
< MDL |
| Al |
0.00236 |
2.5975 |
3.6484 |
2.2142 |
2.0035 |
| Si |
0.48837 |
30.0055 |
43.3769 |
94.4323 |
< MDL |
| P |
0.00862 |
< MDL |
< MDL |
22.2056 |
< MDL |
| S |
0.03108 |
14.5817 |
9.8760 |
103.0854 |
41.5285 |
| K |
0.01264 |
1054.2141 |
6.9061 |
5.6879 |
1.3957 |
| Ca |
0.00150 |
16.3423 |
1.5160 |
60.8525 |
2.6508 |
| Sc |
0.00003 |
< MDL |
< MDL |
0.0340 |
< MDL |
| Ti |
0.00039 |
< MDL |
< MDL |
0.0389 |
< MDL |
| V |
0.00007 |
0.2013 |
0.6033 |
0.0034 |
0.0795 |
| Cr |
0.00028 |
0.0822 |
< MDL |
< MDL |
0.1482 |
| Mn |
0.00033 |
< MDL |
0.0058 |
0.0139 |
0.0908 |
| Fe |
0.00480 |
4.9218 |
2.0979 |
0.9086 |
0.3413 |
| Co |
0.00032 |
0.0282 |
0.0155 |
0.0152 |
0.0165 |
| Ni |
0.00410 |
0.3795 |
0.2135 |
0.2620 |
0.2096 |
| Cu |
0.00057 |
0.0809 |
0.0298 |
0.1300 |
0.0481 |
| Zn |
0.00259 |
4.2295 |
< MDL |
< MDL |
< MDL |
| As |
0.00026 |
0.0271 |
0.2187 |
36.2235 |
0.0022 |
| Se |
0.00076 |
0.0215 |
0.0231 |
0.0023 |
0.0316 |
| Rb |
0.00007 |
0.2276 |
0.0215 |
0.0211 |
0.0051 |
| Sr |
0.00012 |
0.1407 |
< MDL |
2.1795 |
< MDL |
| Y |
0.00002 |
< MDL |
0.0002 |
0.0333 |
0.0004 |
| Zr |
0.00027 |
< MDL |
< MDL |
< MDL |
< MDL |
| Mo |
0.00019 |
0.0602 |
0.0092 |
0.0126 |
0.0217 |
| Ag |
0.00015 |
0.0039 |
< MDL |
0.0003 |
0.0066 |
| Cd |
0.00025 |
0.0045 |
0.0029 |
0.0078 |
< MDL |
| Sn |
0.00822 |
< MDL |
< MDL |
< MDL |
< MDL |
| Sb |
0.00071 |
< MDL |
< MDL |
< MDL |
< MDL |
| Cs |
0.00004 |
0.0010 |
0.0006 |
0.0077 |
0.0004 |
| Ba |
0.00094 |
< MDL |
< MDL |
2.0767 |
< MDL |
| La |
0.00002 |
< MDL |
0.0002 |
0.0015 |
0.0070 |
| Ce |
0.00005 |
< MDL |
< MDL |
0.0301 |
0.0010 |
| Pr |
0.00002 |
< MDL |
< MDL |
0.0001 |
< MDL |
| Nd |
0.00016 |
< MDL |
0.0025 |
0.0029 |
< MDL |
| Sm |
0.00009 |
0.0044 |
0.0035 |
0.0061 |
0.0028 |
| Eu |
0.00006 |
0.0007 |
< MDL |
< MDL |
< MDL |
| Gd |
0.00010 |
< MDL |
< MDL |
0.0382 |
< MDL |
| Tb |
0.00002 |
0.0018 |
0.0004 |
0.0012 |
0.0003 |
| Dy |
0.00008 |
0.0020 |
0.0006 |
0.0065 |
0.0005 |
| Ho |
0.00002 |
0.0001 |
< MDL |
0.0018 |
0.0016 |
| Er |
0.00003 |
< MDL |
< MDL |
0.0034 |
0.0023 |
| Tm |
0.00002 |
< MDL |
0.0003 |
0.0013 |
< MDL |
| Yb |
0.00018 |
0.0019 |
0.0035 |
0.0120 |
0.0026 |
| Lu |
0.00002 |
0.0005 |
0.0005 |
0.0029 |
0.0004 |
| Au |
0.00062 |
0.0283 |
0.0084 |
0.0094 |
< MDL |
| Pb |
0.00025 |
0.0105 |
0.0011 |
0.1738 |
< MDL |
| Bi |
0.00016 |
0.0064 |
0.0087 |
0.0027 |
0.0750 |
| U |
0.00004 |
0.0021 |
0.0168 |
0.0007 |
0.0001 |
| Impurity μg/g) |
|
1653.904 |
77.054 |
595.694 |
51.337 |
| % Impurity |
|
0.1654% |
0.0077% |
0.0596% |
0.0051% |
| % Purity |
|
99.8346% |
99.9923% |
99.9404% |
99.9949% |
Both the lower-grade LiOH and Li2CO3 samples were confirmed as not being within acceptable limits. The LiOH 99.995% compound was found to be 99.992% pure while the Li2CO3 99.998% compound is 99.995% pure, meaning that both of these compounds would fail a QC check under the more stringent purity requirements.
If just the historically analyzed elements are taken into account, these samples would return results of 99.998% and 99.999% purity, respectively, and would be considered within the acceptable limits.
Sodium (Na) and sulfur (S) present distinct challenges when measuring impurities in lithium compounds, but the NexION 5000 ICP-MS enables users to overcome these challenges.
It is vital that Na be accurately measured as its presence causes reduced battery life and an increased risk of explosive events.
Most lithium compounds have very high levels of Na because these tend to originate from brine, meaning that this must be removed or at least considerably reduced to make this a viable material for battery production.
The challenge when using ICP-MS to analyze trace Na in a Li matrix stems from the prevalence of lithium oxide (LiO) interference which occurs at an identical mass to that of Na: m/z 23. Since Na is monoisotopic, no alternative masses can be used.
Two options are available for removing the LiO+ interference on Na:
- A correction equation can be applied using the 6Li isotope. This is done by measuring a known Li standard with each sample set to facilitate accurate correction.
- Eliminating LiO+ interference by reacting this with 100% ammonia in the Universal Cell. As LiO+ reacts with ammonia via charge exchange, this results in neutral LiO, which is invisible at mass 23. Meanwhile, Na does not react with ammonia and stays at mass 23, enabling analysis.
The second option was used in the study presented here, enabling the determination of Na in a more straightforward, rapid and reliable manner.
The measurement of sulfur also poses challenges to ICP-MS because all isotopes occur at the same masses as O2+. S+ reacts with O2 to form SO+ at m/z 48, however, meaning that the addition of O2 to the Universal Cell will readily convert S+ to SO+.
Another issue arises in that titanium (Ti), and calcium (Ca) isotopes also exist at mass 48. Ti+ reacts with O2 to create TiO+, meaning that this does not interfere with SO+.3 Ca+ does not react with O2, however, which does interfere with SO+.
A correction equation is typically applied in single quadrupole instruments to account for the Ca interferences at mass 48.
The NexION 5000 multi-quadrupole ICP-MS can address this issue easily, however, by setting the first resolving quad (Q1) to mass 32, allowing only O2+ and S+ to pass into the Universal Cell, therefore removing Ca.
The sulfur will react with oxygen to form SO+, and the second resolving quad (Q3) is set to mass 48, meaning that only SO+ is permitted to reach the detector. There is no need to employ correction equations when using the NexION 5000 ICP-MS because both Ti and Ca cannot pass beyond Q1.
Figure 1 displays plots of impurities of the four measured compounds. Shades of blue represent impurities that are conventionally measured in lithium salts, while the ‘other’ represents the further impurities measured in this study.
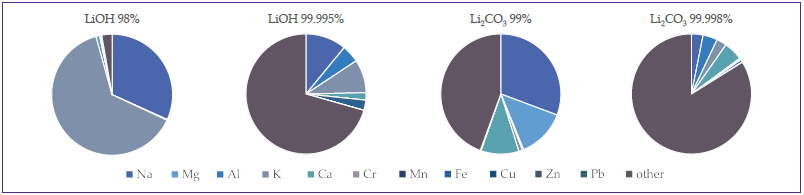
Figure 1. Graphic depictions showing the distribution of impurities. The impurities that are currently measured are listed, while the other section includes all other impurities. Image Credit: PerkinElmer
Most of the impurities in 98% LiOH and 99% Li2CO3 were found to be the historically measured elements, but in 99.995% LiOH and 99.998% Li2CO3, most of these impurities are ‘other’ elements specifically measured in this study.
These plots highlight the significance of measuring a range of additional elements when evaluating the purity of the lithium salts employed in lithium-ion battery production.
Conclusion
Lithium batteries represent a key commodity that is central to contemporary society. It is anticipated that the demand for more efficient, longer-life batteries will only increase as the world makes the necessary move away from fossil fuels.
As Li salts utilized in battery production are typically extracted from brines, these tend to exhibit high levels of impurity.
The purity of these salts can affect battery efficiency, lifetime and stability, meaning that increasingly higher raw material purity is essential. The elemental analysis methods currently employed in battery production are fast becoming inadequate for these higher-purity materials.
The study presented here has highlighted that as Li salt purity increases, it is necessary to analyze more than the impurity elements that have been historically analyzed. The results of this study show that most of the impurities detected stem from elements that were not traditionally measured.
The NexION 5000 ICP-MS offers outstanding detection limits and interference correction ideal for the analysis of Li salts. This suitability is largely due to its multi-quadrupole technology, quadrupole Universal Cell and diverse range of other useful proprietary features.
References
- NexION 5000 Multi-Quadrupole ICP Mass Spectrometer, Product Note, PerkinElmer, 2020.
- All Matrix Solution System for NexION ICP-MS, Technical Note, PerkinElmer, 2020.
- Bandura, D.R.; Baranov, V.I.; Tanner, S.D. “Detection of Ultratrace Phosphorus and Sulfur by Quadrupole ICPMS with Dynamic Reaction Cell”, Analytical Chemistry 2002 74(7), 1497-1502.
Consumables Used
Table 6. Source: PerkinElmer
| Component |
Part Number |
| PFA ST3 Nebulizer with Integrated Gas Line |
N8152378 |
| Fixed 2.0 mm Injector UHP Quartz Torch |
N8152428 |
| SilQ Spray Chamber with AMS Gas Port |
N8152539 |
| Grey/Grey 1.30 mm I.D. Santoprene Peristatic Pump Tubing |
N8152415 |
| Orange/Green Flared 2-Stop PVC Pump Tubing |
N8145197 |
| Gas Line-Matrix |
N8152374 |
Acknowledgments
Produced from materials originally authored by Ruth Merrifield from PerkinElmer Inc.

This information has been sourced, reviewed and adapted from materials provided by PerkinElmer.
For more information on this source, please visit PerkinElmer.