Total organic carbon (TOC) analysis is a frequently used technique for determining water purity. The more organic carbon in the water, the higher the level of impurities. Different sectors must adhere to different standards for acceptable water purity in final goods and water utilized in manufacturing.
Food and beverage firms are increasingly using TOC analysis to confirm that their equipment is clean and allergen-free between manufacturing batches. While TOC is not a specialized test for the presence of allergens, it is a thorough test for carbon.
This implies that the data would provide manufacturers with a precise estimate of the entire degree of pollution following a cleaning operation, including the presence of any allergens such as gluten. The presence of contaminants may be determined not only by the TOC value but also by conductivity data that can be obtained at the same time.
Background
Gluten is made up of two proteins: gliadin, which is water-insoluble, and glutenin, which has a greater solubility. ELISA testing for this allergen measures the presence of gliadin, with a limit of detection that is generally in the range of 1–5 parts per million (ppm). It is not required to test for the whole complex because gliadin is the part of gluten that causes an allergic/sensitive reaction.1
ELISA testing is used to detect particular organic contamination using antibodies, whereas TOC testing may detect organic contamination of any kind in a sample without using antigens.
When directly comparing TOC with ELISA, there are some crucial considerations to keep in mind:
- Traditional ELISA testing measures the amount of water-soluble glutenin present, with a limit of detection (LOD) ranging from 1 to 5 ppm glutenin.
- A TOC analysis determines the total amount of organic carbon in ppm. The LOD of Sievers M9 Analyzers is 30 ppt (or 0.00003 ppm).
- Gliadin is roughly 55% carbon in its monomeric form,2,3 resulting in a LOD of 0.55–2.75 ppm C for ELISA testing as gliadin.
- ELISA testing employs antigens to target particular allergen proteins, whereas TOC is a non-specific test that detects all organic carbon pollution.
- Organic pollutants are collected and tested using a single sample vial in TOC analysis. The preparation of samples for ELISA testing requires many processes before they can be transferred to a 96-well plate.
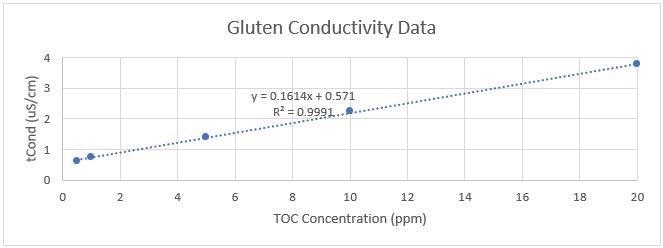
Sievers M-Series Analyzers are able to simultaneously take TOC and conductivity measurements at the same time. This additional layer of information can aid in determining the nature of any impurities that persist after equipment cleaning. An increase in conductivity can be used to confirm the presence of organic contamination in a sample.
Challenge
Food and beverage makers have a unique set of obstacles when operating in facilities that generate both gluten-containing and gluten-free goods, with an expanding population of customers requiring or opting for a gluten-free diet.
If a facility is unable to designate discrete sections for the manufacture of allergen-free meals or drinks, equipment is thoroughly cleaned between batches to guarantee that no ingredients are carried over from one batch to the next.
Following cleaning, allergy testing is required to validate the absence of the specified ingredient. This testing is time-consuming as it necessitates the collecting of samples, as well as the hands-on attention of a technician who has been trained to perform the test.
Solution
Sievers M-Series TOC Analyzers estimate the organic content of water with industry-leading accuracy and precision by combining UV-persulfate oxidation with membrane conductometric technology. These analyzers have a detection limit of 30 parts per trillion (0.03 ppb) and a range of 50 ppm.
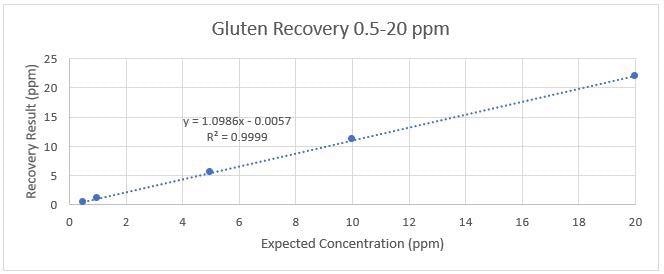
Sievers M-Series Analyzers can also measure conductivity in addition to TOC measurements, allowing for a side-by-side comparison. The recovery of gluten in water was tested to simulate the quantity of organic C present in a sample containing gluten contaminants (see Table 1).
Table 1. Results for gluten recovery at concentrations ranging from 0.5–20 ppm C as gluten. St Dev = standard deviation, RSD = relative standard deviation, tCond = temperature corrected conductivity. Source: Veolia Water Technologies & Solutions
| Sample |
TOC Results (ppm) |
St Dev (ppm) |
% RSD |
% Recovery |
| 0.5 ppm C as Gluten |
0.501 |
0.016 |
3.19 |
100 |
| 1 ppm C as Gluten |
1.04 |
0.010 |
0.92 |
104 |
| 5 ppm C as Gluten |
5.53 |
0.025 |
0.44 |
111 |
| 10 ppm C as Gluten |
11.1 |
0.082 |
0.74 |
111 |
| 20 ppm C as Gluten |
21.9 |
0.189 |
0.87 |
110 |
As illustrated in Figure 1, conductivity analysis assists in confirming the degree of contamination. As demonstrated in Figure 2, the increase in conductivity is proportional to the amount of organic C contained in a sample.

Figure 1. TOC results for gluten recovery. Image Credit: Veolia Water Technologies & Solutions

Figure 2. Conductivity results for gluten recovery indicating the increase of conductivity proportional to the gluten recovery in Figure 1. Image Credit: Veolia Water Technologies & Solutions
As gluten is weakly soluble in water, a suspension was made, and the average TOC was determined using a 0.01% dilution. This finding was utilized to compute the stock solution’s total TOC content, and dilutions for the recovery research were subsequently prepared. For all samples, conductivity measurements were acquired at the same time.
Conclusion
TOC analysis enables manufacturers to assess the total degree of contamination of a production line. It may also be used to detect contaminants like gluten in food and beverage facilities.
The Sievers M-Series analyzer can successfully retrieve gluten at concentrations ranging from 0.5 ppm to 20 ppm C as gluten, according to the results. Across this concentration range, both TOC and conductivity measurements demonstrate linear recovery.
Compared to typical ELISA testing, Sievers Instruments equipment delivers complete data for organic contamination with higher sensitivity and a significantly lower limit of detection. When compared to ELISA testing, TOC analysis also allows the user to sample from a single vial, minimizing the number of procedures and sample preparation time.
References
- C. HISCHENHUBER, R. B.-V.–,. (2006). Review article: safe amounts of gluten for patients with wheat allergy or coeliac disease. Alimentary Pharmacology & Therapeutics, 559-575.
- Information, N. C. (2022, April 04). PubChem Compound Summary for CID 17787981, Gliadins. Retrieved from PubChem: https://pubchem.ncbi.nlm.nih.gov/compound/Gliadins.
- Wieser, H. (2007). Chemistry of gluten proteins. Food Microbiology, 115-119.

This information has been sourced, reviewed and adapted from materials provided by Veolia Water Technologies & Solutions.
For more information on this source, please visit Veolia Water Technologies & Solutions