Selected ion flow tube mass spectrometry (SIFT-MS) combined with headspace analysis offers fast, sensitive quantitation of benzene in commercial, personal care products. Matrix effects, as a result of the variably complex compositions of personal care products, are directly addressed through routine additions in a matrix-matching approach.
The high sample throughput of SIFT-MS implies that calibration curves for each matrix are produced at a rapid rate in contrast to gas chromatography-based analyses, making the standard additions method more economical when using SIFT-MS, with faster time to the first result and 12 samples screened per hour on a subsequent basis.
In this article, we look at a study in which four commercial personal care product matrices were tested: a crushed tablet, a syrup, a creamy lotion (called ‘lotion’), and an oily lotion.
Across the four products, benzene was identified from ca. 20 to 600 parts per billion (ppb) with good repeatability. The apparent ease with which SIFT-MS analyzes benzene with high-specificity across a range of matrices means that it is well-suited to product quality control in the testing laboratory and the process line.
Introduction
Benzene is a contaminant in several commercial personal care products (PCPs), including sunscreens, body sprays, and dry shampoo (Valisure (2022); Bettenhausen (2022)). Chronic exposure to benzene is associated with a considerable and heightened risk of certain cancers, including leukemia.
It is critical to test for benzene and other toxic volatile organic compounds (VOCs) in PCPs to limit their presence in these products. Traditionally, analysis of benzene in PCPs is performed using headspace-gas chromatography-mass spectrometry (GC/MS).
However, it has been recently demonstrated that automated selected ion flow tube mass spectrometry (SIFT-MS) can detect benzene in aqueous headspace with greater sensitivity (Perkins and Langford (2021a)), achieving sub-ppb levels in solution (Perkins and Langford (2022)). It can reach such low quantitation limits while promoting higher sample throughputs and improved time to result.
The study above extends the application potential of headspace-SIFT-MS to the analysis of benzene in PCPs. Several PCPs have complex matrices that present challenges when determining partition coefficients between the condensed phase and headspace.
A matrix-matching approach using standard additions is required for such analysis (Perkins and Langford (2021b)). In this article, both the compatibility of this routine approach with SIFT-MS and the speed with which it can be carried out are discussed and evaluated.
In under three hours, seven-point calibration curves were produced for four PCPs, and benzene was accurately quantified for these products.
Method
1. The SIFT-MS Technique
During the study, a Syft Technologies Voice200ultra SIFT-MS instrument that operated with a helium carrier gas was used. SIFT-MS (Figure 1) utilizes soft chemical ionization (CI) to yield mass-selected reagent ions (Smith et al. (2020)) that can react rapidly with and quantify VOCs close to part- per-trillion concentrations (by volume, pptV).

Figure 1. Schematic diagram of SIFT-MS – a direct, chemical-ionization analytical technique. Image Credit: Syft Technologies
Circa eight reagent ions (H3O+, NO+, O2+, O-, OH-, O2-, NO2- and NO3-) acquired from a microwave discharge in the air are now used in commercial SIFT-MS instruments (Hera et al. (2017)).
These reagent ions react with VOCs and other trace analytes in carefully controlled ion-molecule reactions, but they show no signs of reacting with the major elements found in air (N2, O2, and Ar). This enables direct, real-time analysis of air samples to be completed at trace and ultra-trace levels without the need to pre-concentrate samples.
Quickly switching between reagent ions facilitates high selectivity due to the multiple reaction mechanisms and their independent measurements of each analyte. The multiple reagent ions repeatedly eliminate any uncertainty from isobaric overlaps in mixtures that contain multiple analytes. Automated MHE analysis was performed with a SIFT-MS instrument paired with a multipurpose autosampler (MPS Robotic Pro, GERSTEL; Mülheim, Germany).
The autosampler was carefully controlled with GERSTEL’s Maestro software. Using a GERSTEL agitator, samples were incubated at 37 °C for 20 minutes. Using a 2.5-mL headspace syringe (heated to 150 °C), headspace was sampled and injected at a flow rate of 50 μL s-1 into the SIFT-MS instrument’s autosampler inlet (heated to 150 °C) with the application of a self-sealing GERSTEL septumless sampling head.
The introduction of a make-up gas flow (ultra-high purity nitrogen) through the sampling head was required due to the nominal sample flow into the SIFT-MS instrument being 420 µL s-1. This dilution is accounted for automatically, as shown in the calibration procedure below.
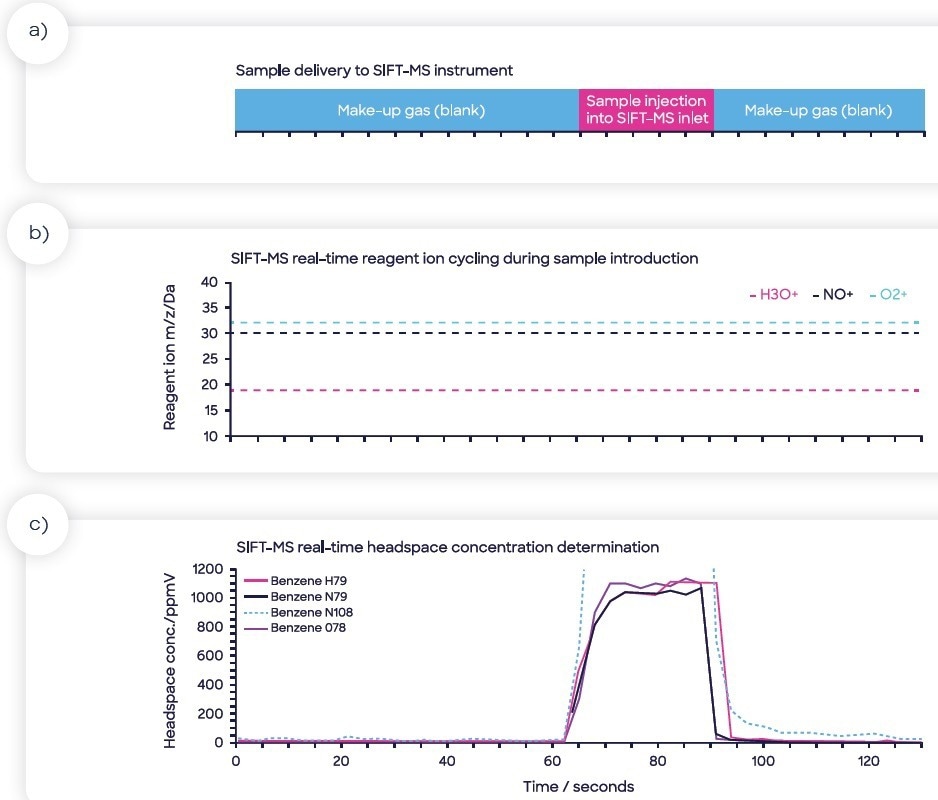
The analysis time for each of the samples was 130 seconds. An example headspace injection is displayed in Figure 2, with four ions targeted for benzene (the method also targeted nine other compounds, but they were not reported as part of the study herein).

Figure 2. Sample injection of sample headspace into the SIFT-MS sample inlet: (a) sample injection is flanked by make-up gas measurements (nitrogen blank), (b) rapid cycling of the SIFT-MS reagent ions to maximize specificity and sensitivity, (c) calculated headspace concentration data in real-time showing the four benzene product ions. Image Credit: Syft Technologies
Figure 2 also highlights the real-time switching of reagent ions, a feature unique to SIFT-MS, which optimizes specificity in real-time. The benzene concentration in each product was determined by calculating the relationship between headspace concentration (measured using SIFT-MS, part-per-billion by volume, ppbV) and matrix concentration (ppb in the product itself). This partitioning differs from product to product and is considered by the matrix-matching procedure.
2. Samples, Calibration, Scheduling, and Calculations
Pure benzene standard (USP; acquired from Valisure, LLC) produced a 2000-ppm stock solution by introducing 20 μL of benzene to 10 mL of DMSO. Preparation of a working solution at 20 ppm was then conducted by adding 100 μL of the stock up to 10 mL with deionized water.
Each sample was weighed into 10 x 20 mL headspace vials with 500 µg per vial. Seven-point calibration curves (10, 50, 100, 250, 500, 1000, and 2000 ppb) were produced by spiking the right working solution into each matrix and using deionized water to dilute them up to 5 mL.
Subsequently, deionized water was also used to bring three samples of each matrix up to 5 mL without additional benzene. Each of these samples was vortexed for two minutes to homogenize the sample completely. The lotion samples were vortexed for an extra two minutes because they proved difficult to homogenize.
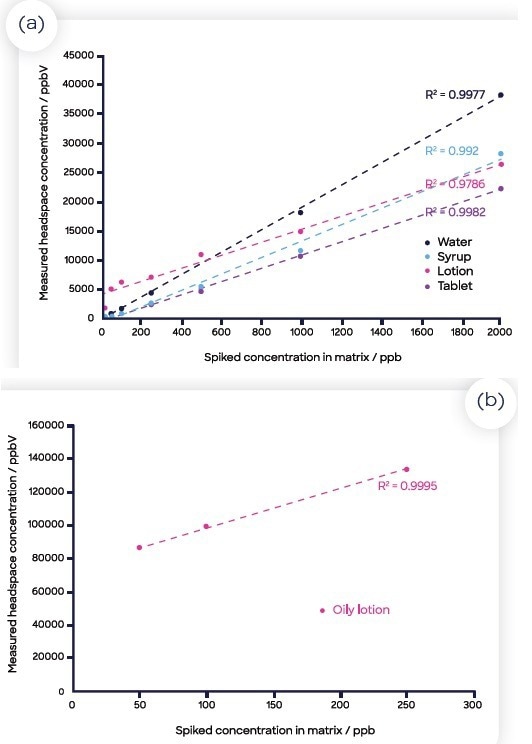
The calibration curves for each of the four matrices and the benzene in water are displayed in Figure 3. The run of each calibration curve was ordered in series from lowest to highest concentration of benzene, with the zero-benzene samples for each matrix spread throughout the run with blanks.

Figure 3. Standard curves for benzene spiked into the four matrices (and water): (a) water (blue), the crushed tablet (orange), syrup (gray), lotion (yellow) and oily lotion (green); (b) oily lotion (plotted separately as the concentration values measured were significantly larger than the other matrices). Image Credit: Syft Technologies
Incubations were also spread out which allowed for the analysis of 21 standards, six blanks and nine samples in under three hours. Ensuring a homogenous solution for the oily lotion in water proved challenging, so a reduced number of data points were used from the calibration curve (Figure 3(b)).
Results and Discussion
Matrix matching each PCPs using calibration utilizing benzene spiked at seven concentrations facilitated simple identification of the benzene concentration in the PCPs by correlating the concentration measured with the application of headspace-SIFT-MS to the benzene concentration in the matrix.
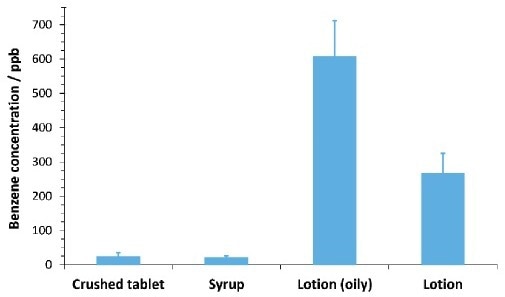
As illustrated in Figure 4, benzene was identified at around ca. 20 to 600 ppb in the four commercial PCPs with excellent repeatability. Solubility of the commercial products in water played a key part in ensuring the repeatability of the headspace measurement quality control specialists, and testing agencies to trace benzene contamination emissions and efficiencies at a cost-effective level.

Figure 4. Benzene concentrations in four personal care products of differing formulation. Error bars indicate one standard deviation calculated from four replicates of each sample (except oily lotion, with two replicates). Concentrations were calculated from the standard additions curve for the matrix (Figure 3). Image Credit: Syft Technologies
Conclusions
The rapid, highly sensitive and specific analysis of benzene was achieved across a diverse range of commercial personal care products. The quick generation of calibration curves (utilizing the approach of the standard addition) for matrix matching enabled the analysis of 12 samples per hour. The system can utilize parallel headspace incubation of both solid and aqueous samples as well as achieve wide dynamic and linear ranges. With simple operation and industry-proven technology, this new approach is ready for the QA/QC lab and process line.
References
- Bettenhausen, C.A. Finding benzene everywhere we look. Chem. & Eng. News. 2022, 100(1), 24-26.
- Valisure (2022). Valisure citizen petition on benzene in dry shampoo products (October 31, 2022).
- Hera D, Langford VS, McEwan MJ, McKellar TI, Milligan DB (2017). Negative reagent ions for real time detection using SIFT-MS. Environments 4, 16. DOI: 10.3390/ environments4010016.
- Perkins MJ, Langford VS (2021a). Standard validation protocol for selected ion flow tube mass spectrometry methods applied to direct headspace analysis of aqueous volatile organic compounds. Anal Chem. 93, 8386-8392. DOI: 10.1021/acs.analchem.1c01310.
- Perkins MJ, Langford VS (2021b). Application of routine analysis procedures to a direct mass spectrometry technique: selected ion flow tube mass spectrometry (SIFT-MS). Rev Sep Sci. 3, e21003. DOI: 10.17145/rss.21.003.
- Perkins MJ, Langford VS (2022). Application of headspaceSIFT-MS to direct analysis of hazardous volatiles in drinking water. Submitted to Environments.
- Smith D, McEwan MJ, Španěl P (2020). Understanding gas phase ion chemistry is the key to reliable selected ion flow tube-mass spectrometry analyses. Anal. Chem. 92, 12750- 12762. DOI: 10.1021/acs.analchem.0c03050.

This information has been sourced, reviewed and adapted from materials provided by Syft Technologies.
For more information on this source, please visit Syft Technologies.