Inks and paints are everywhere in the world around us. As well as for writing and printing, these materials are also used for protection against the elements and aesthetic reasons. These substances have, to some extent, allowed humanity to preserve historical records.
This article outlines how paints and inks are manufactured and what quality control (QC) measures are taken. Furthermore, a brief history of this industry, the manufacturing process, and how near-infrared spectroscopy (NIRS) can be leveraged as a multi-parameter QC solution will be described.
What is the Difference Between Paint and Ink?
Paint is a substance typically applied as a liquid or paste that, when dried, solidifies into a protective coating. This coating also adds aesthetic qualities, such as color, to the object or surface.
Ink is a pigment or dye-based fluid generally used for writing, printing, etc.
Origins and Brief Historical Overview of Ink and Paint
Ink
Many cultures were able to formulate their own inks independently of one another. These were usually comprised of leftover soot (pigment) from firepits in combination with water (carrier). This simple composition makes up the bulk of India ink, which is still being used today.
Around 4,500 years ago, Chinese and Egyptian cultures established durable ink compositions. These ink recipes were based on plant, animal, and mineral sources. In Europe, before the Middle Ages, ink compositions were made up of black carbon powder and water, bound using gum arabic and other binders.
In time, the Romans produced a much-improved formula known as iron (or oak) gall ink. Iron gall ink was fairly straightforward to mix to create ink from iron(II) sulfate (FeSO4), tannic acid, and gum arabic. This permanent ink was still in use until chemically produced ink became increasingly popular around the mid-1900s.
In the 1440s, as the printing press emerged, a new type of ink was required. Water-based inks were not good for achieving quality printing. Resultingly, oil-based inks were developed for better adherence to the printing surface.
Paint
Paint used to decorate or protect surfaces is most commonly found in its liquid state. It is hard to pinpoint the historical timeline exactly when the first paintings were first made, as they predate written history. The oldest paint records are usually attributed to cave paintings, such as those found in France, Spain, and South Africa. These primitive paints were created by grinding pigmented substances like ochre and mixed with a simple liquid binder such as eggs to allow them to better stick to stone surfaces.
Throughout history, water-based paints have been used to produce enduring, timeless works of art. For example, the ancient Egyptians used vibrant, bold hues to decorate their burial chambers. Later, Michelangelo used a simple powdered pigment mixed with water (fresco) when painting the famous Sistine Chapel ceiling.
Oil-based paints were thought to have been developed as early as 600 AD, as seen in cave paintings found in Afghanistan. These paints use drying oils rather than water and may sometimes contain other modifiers.
Oil paints also play a key role in the fine arts seen in use in classic works such as The Mona Lisa by Leonardo da Vinci and The Starry Night by Vincent van Gogh, but they remain popular for protective reasons, such as making wood waterproof.
Natural pigments are typically sourced from plant, mineral, or clay sources. Synthetic pigments, on the other hand, are formulated using chemical, thermal, or other processing techniques and offer a far greater variety of colors. Both natural and synthetic pigments can be categorized as organic or inorganic.
Furthermore, carriers and binders can also be grouped into natural and synthetic categories and are widely available. Previously, oil-based paints would use linseed oil as a carrier until, in the early 1900s, artificial alkyds were created and used for this purpose.
Alkyds were durable, easy to make, held color well, and were relatively inexpensive. Then, the development of polymer-based paints, such as acrylic and latex, came about and these types of paint remain popular today.
Synthetic binders led to the development of fast-drying paints as well as reducing yellowing tendencies and offering a wide range of appearance and handling properties. For emulsion formulations, the advent of synthetic binders ended the use of organic solvents as thinners and diluents.
What is Paint Made of?
Paint is generally composed of pigment, resin, solvent, and other additives.
Pigment
Pigments bring color and control to the levels of gloss and finish. A lower pigment volume concentration (PVC) produces a glossy finish while a high PVC offers a flat matte appearance.
Resin
Resins bind the pigment particles together and facilitates adhesion to the surface being painted.
Solvent
Either organic or water-based, the solvent is the carrier for both the pigments and resin.
Additives
Additives are introduced into paint mixes to improve certain properties such as drying speed, ease of brushing, resistance to mold, scuff resistance, and sag resistance.
How is Paint Manufactured?
The manufacturing process for paint can be separated into four basic steps.
First, the paste is made (Figure 1), followed by milling of the pigments which are dispersed for homogeneity purposes (Figure 2). Then, the paste is thinned (Figure 3), and finally the final paint product is packaged (Figure 4).
However, while this example serves as a generalization of the manufacturing process, certain ingredients require modification of the production process. Coatings are produced in a batch process and tests following strict regulations are applied throughout the entire production line to ensure quality.
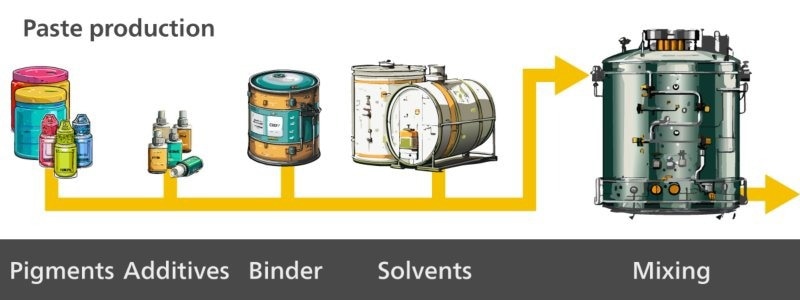
Figure 1. The first step in paint production is making the paste by mixing pigments, additives, binder, and solvents. Image Credit: Metrohm Middle East FZC
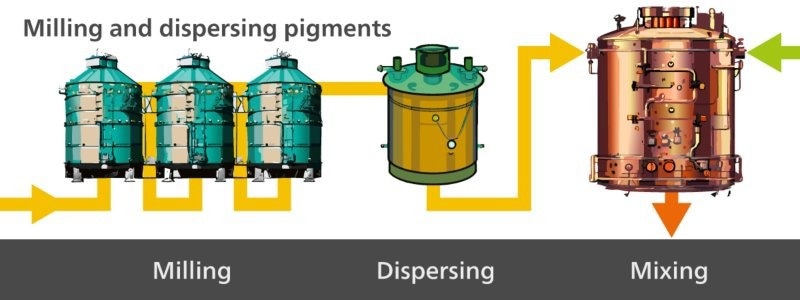
Figure 2. The second step in paint production is milling and dispersing pigments in the paste. Image Credit: Metrohm Middle East FZC
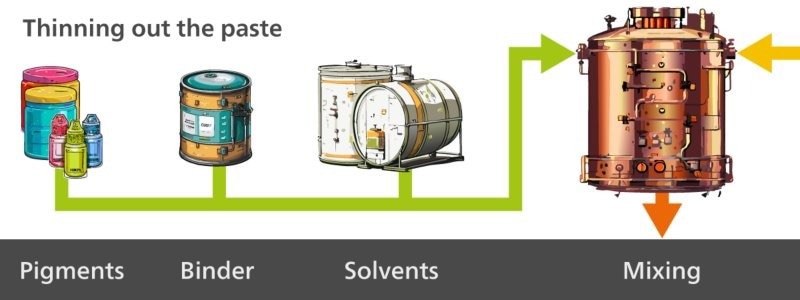
Figure 3. The third step in paint production is where the paste is thinned out with solvents, binder, and additional pigments. Image Credit: Metrohm Middle East FZC
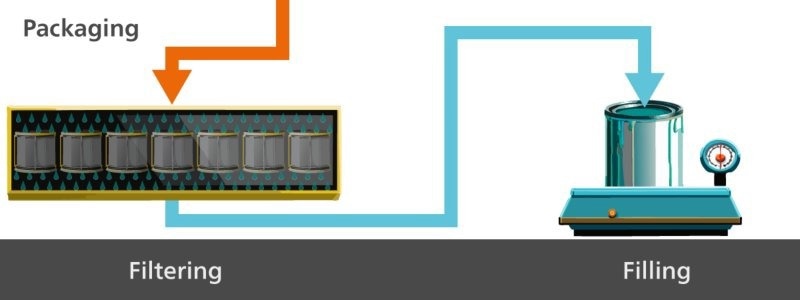
Figure 4. The final step in paint production is packaging the final product once it has been filtered. Image Credit: Metrohm Middle East FZC
Quality Control and Screening of Ink and Paint
Quality control (QC) of ink and paint can be easily performed throughout each stage of production with near-infrared (NIR) spectroscopy. Using NIRS for QC and screening, the analysis of of ink and paint is more efficient and cost-effective than other techniques.
Examples of how ink and paint producers can take advantage of NIRS instruments for assurance and quality control to make high-quality products along with how NIRS works will follow.
NIR Spectroscopy – How Does It Work?
Analytical NIR spectroscopy uses the interaction between light and matter to identify a sample’s chemical and physical parameters. Throughout NIRS analysis, light is determined by a factor of its wavelength or wavenumbers as opposed to its applied energy.
The interaction between light and matter can be measured using the Metrohm DS2500 Liquid Analyzer (Figure 5a), which can create NIR spectra as required (Figure 5b).
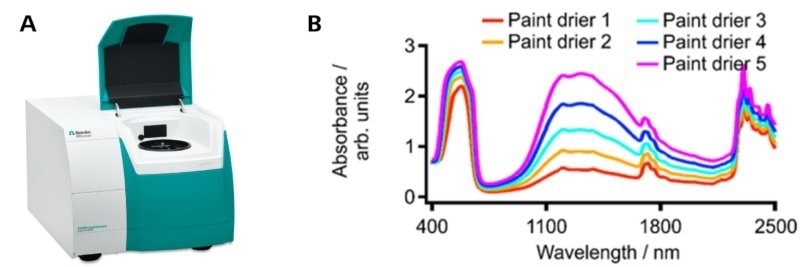
Figure 5. a) The Metrohm NIRS DS2500 Liquid Analyzer. b) Example of spectra resulting from the interaction of NIR light with five different paint drier samples. Image Credit: Metrohm Middle East FZC
NIRS is rather sensitive to the presence of some molecular functional groups, making it a technique well-suited to the quantification of different chemical parameters.
Therefore, in paints and inks, it is possible to measure non-volatile content, volatile organic compounds, dye content, surfactant content, and moisture simultaneously. NIRS even facilitates the detection of physical parameters, such as density and viscosity.
A single NIR spectrum is able to generate all of the required data, making near-infrared spectroscopy ideal for rapid multi-parameter analysis.
Choice of NIRS Measuring Mode
When choosing an appropriate NIRS measuring mode the type of sample to be analyzed should always be considered.
For liquid analysis, the transmission mode is recommended as shown in Figure 6. During transmission, NIR light is absorbed while passing through the sample, and any unabsorbed light is picked up by the detector.
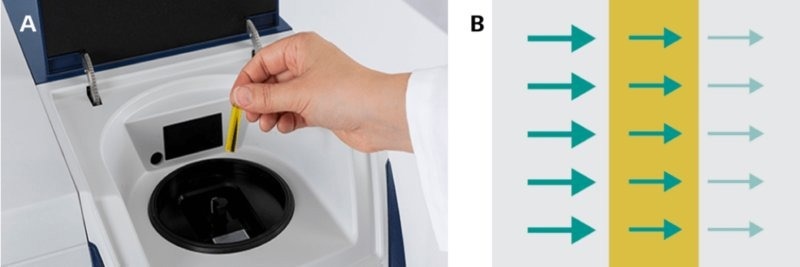
Figure 6. a) Measurements of liquids are typically done with disposable vials. b) The NIRS measurement mode is known as transmission, where light travels through the sample while being absorbed (from left to right in the illustration). Image Credit: Metrohm Middle East FZC
When analyzing pastes, the transflection mode is best suited as displayed in Figure 7. Here, a gold stamp is inserted to act as a diffuse reflector. In this instance, the NIR light is transmitted through the paste sample where it is absorbed. The light reflected by the gold stamp is further absorbed by the sample and eventually reaches the detector.
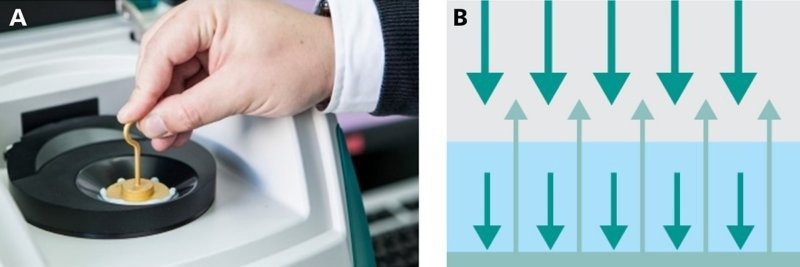
Figure 7. a) The measurement of pastes is typically done in a slurry cup by using a gold stamp as the diffuse reflector. b) The measurement mode is known as transflection, where light travels through the sample, reflects on the diffuse reflector, and travels again through the sample while being absorbed. Image Credit: Metrohm Middle East FZC
Advantages of Using NIRS For QC and Screening Purposes
Near-infrared spectroscopy has a number of advantages compared to other analytical techniques, particularly in quality control and screening.
NIRS provides results in less than one minute making a rapid analytical technique. Moreover, with no sample preparation required, users save even more time.
Samples that can be reused as measurements are produced via a non-destructive technique. Costs are lowered as no reagents are needed, which also makes this technique environmentally friendly.
NIRS complies with international standards such as ASTM E1655: Standard Practices for Infrared Multivariate Quantitative Analysis, this makes implementing NIRS a straightforward process across most industries. Finally, NIRS is user-friendly and can be operated by inexperienced personnel, unlike other more complex analytical techniques.
Quality Control and Screening Parameters for Ink and Paint Production
Ink and paint products often undergo a series of standardized test methods to establish their chemical and physical properties. Such laboratory testing is a crucial part of research and development and quality control.
In Table 1, the most relevant test parameters for the quality control and screening of ink and paintare displayed.
Table 1. Various QC and screening parameters for ink and paint along with the typical method used for analysis. Source: Metrohm Middle East FZC
| Parameter |
Conventional analysis method |
| Intrinsic, kinematic viscosity |
Viscometry |
| Moisture |
Karl Fischer titration |
| Surfactant content |
Titration |
| Non-volatile content / Solids content |
Loss on drying (LOD) |
| Dye content / Pigment content |
Ashing |
| Volatile organic compounds (VOC) |
Multiple wet chemical methods |
| Additives and wax in packaging paint |
HPLC and GC |
The capabilities of NIRS for the simultaneous analysis of these parameters from the same sample is described in the following examples.
Application Example: Quality Control of Ink with NIRS
When quality control checks are being performed during ink production, the most common parameters measured are dye content, diethylene glycol (DEG), surfactant, and water content.
The dye (e.g., triphenylmethane/phenazine or azo dyes) is what gives the ink its color. Diethylene glycol prevents the ink from drying out acting as the solvent. Surfactants prevent any foaming of the ink by controlling the texture.
To determine these parameters various analytical techniques are usually used such as ashing, titration, and Karl Fischer titration. However, sample preparation can be time-intensive, and the use of several different determination methods is laborious. However, using NIRS, a number of key QC parameters for ink can be simultaneously measured, with results delivered in less than one minute.
NIR spectra from a number of ink samples are displayed in Figure 8 with Figure 9 displaying the relevant correlation diagram for the prediction of dye content. The figures of merit for the NIRS prediction of dye, DEG, surfactant, and water in ink are shown in Table 2.
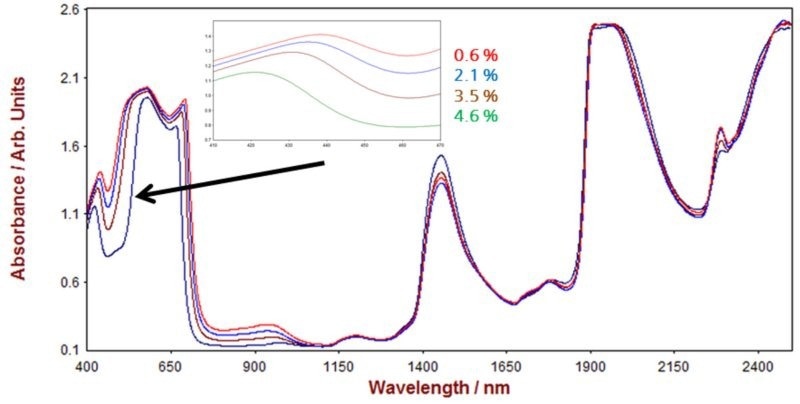
Figure 8. Selection of Vis-NIR spectra from ink samples measured on a Metrohm NIRS DS2500 Analyzer in transflection mode. The inlay shows how the spectra differ with varying dye content. Image Credit: Metrohm Middle East FZC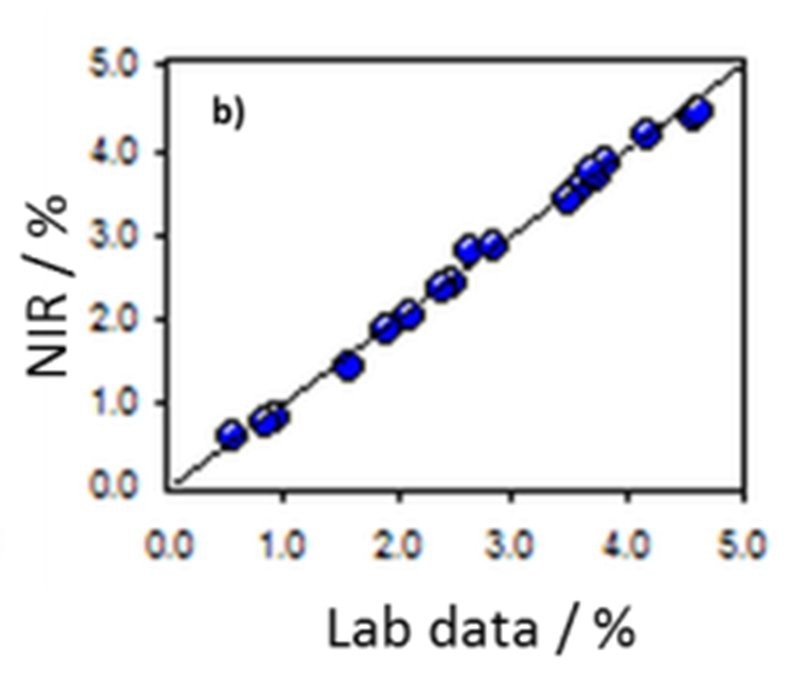
Figure 9. Correlation diagram for the prediction of dye content in ink using a Metrohm NIRS DS2500 Analyzer. Image Credit: Metrohm Middle East FZC
Table 2. Figures of merit for various QC parameters in ink samples using a Metrohm NIRS DS2500 Analyzer. Source: Metrohm Middle East FZC
| Figures of merit |
Dye content |
DEG content |
Water content |
Surfactant content |
| R2 |
0.996 |
0.993 |
0.991 |
0.977 |
| Standard Error of Calibration (SEC) |
0.0835% |
0.5037% |
0.5571% |
0.0368% |
| Standard Error of Cross Validation (SECV) |
0.0949% |
0.5888% |
0.9614% |
0.1316% |
Application Example: Quality Control of Paint Driers with NIRS
Paint driers typically speed-up the drying times of paints and while also influencing overall the gloss and clarity of the coating. In this instance, the primary parameters of interest for QC are the solid content, metal content, viscosity, and specific gravity.
Each of the reference test procedures for these parameters are covered in the following ASTM procedures; ASTM D2373, ASTM D1644, ASTM D5125, and ASTM D2196.
A variety of analytical instruments were used for the measurements in each procedure: balances and ovens, titrators, hydrometers, and viscometers. Conversely, leveraging the advantages of NIRS to simultaneously measure all of these parameters leads to a significant time savings and limits the costs per analysis.
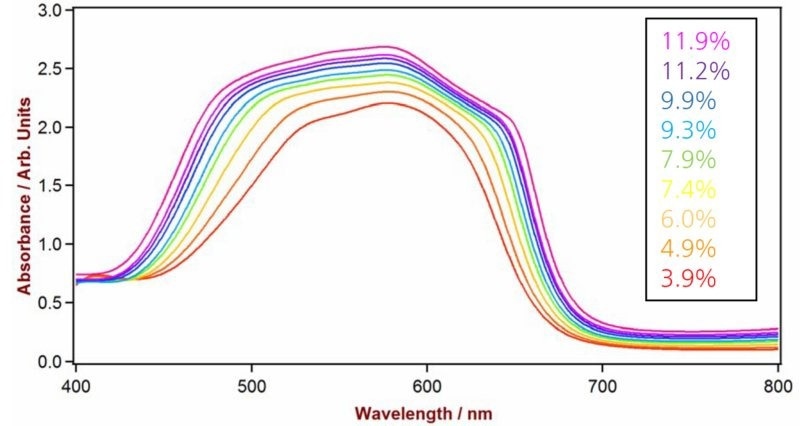
Figure 10. Selection of Vis-NIR spectra from paint drier samples measured on a Metrohm NIRS DS2500 Liquid Analyzer in transmission mode. The spectra differ with varying cobalt content. Image Credit: Metrohm Middle East FZC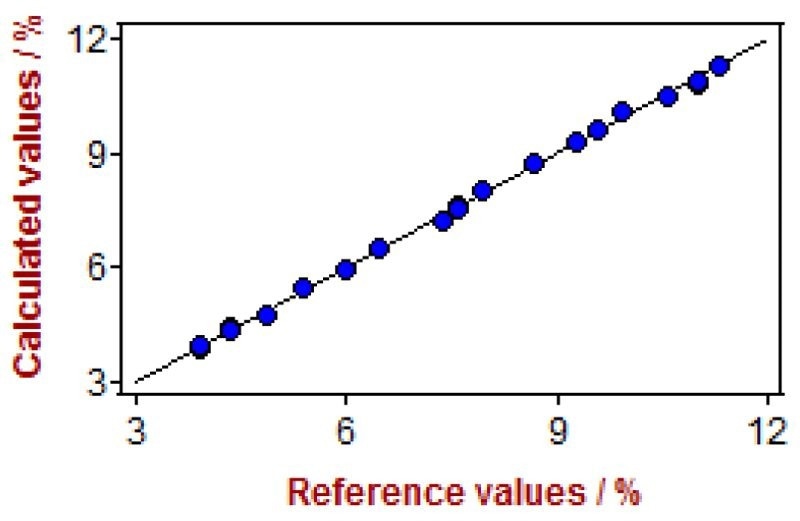
Figure 11. Correlation diagram for the prediction of cobalt content in paint driers using a Metrohm NIRS DS2500 Liquid Analyzer. Image Credit: Metrohm Middle East FZC
Table 3. Figures of merit for various QC parameters in paint drier samples using a Metrohm NIRS DS2500 Liquid Analyzer. Source: Metrohm Middle East FZC
| Figures of merit |
Cobalt content* |
Solids content |
Specific gravity |
Viscosity |
| R2 |
0.999 |
0.999 |
0.977 |
0.999 |
| SEC |
0.08% |
0.24% |
0.003% |
9.3 MPa |
| SECV |
0.09% |
0.29% |
0.003% |
10.9 MPa |
* The spectral range with best results for cobalt measurement was in the visible region (400–800 nm, see Figure 9).
Summary
NIRS is the ideal choice for quality control and screening of ink and paint at any point in the production process. From the analysis of raw materials to evaluating finished products, NIRS has several advantages over competing analytical techniques and should not be understated.
The capability to run multi-parameter analysis on a single sample and have the results ready in under one minute saves vast amounts of time and money.
Traditional laboratory techniques typically necessitate sample preconditioning or chemicals and skilled personnel to run the analyses. Result acquisition is also more cumbersome using conventional methods as each parameter is measured on a different instrument.

This information has been sourced, reviewed and adapted from materials provided by Metrohm Middle East FZC.
For more information on this source, please visit Metrohm Middle East FZC.