Ptychography is an area-by-area scanning method that uses constant, coherent illumination to scan a region of a sample in several adjacent and overlapping locations. The dispersed radiation is permitted to propagate, and the resulting diffraction pattern is monitored with a 2D pixelated detector.
The dataset’s redundancy is combined with an iterative optimization process to generate quantitative, full-field images with diffraction-limited spatial resolution and sensitivity to phase contrast and amplitude.
This article examines how ptychography works and whether it is worth the hype.
Electron microscopes have short wavelengths (a few picometers) and can resolve individual atoms inside a lattice.
Recent improvements in electron detector technology and the adoption of creative imaging processes have shifted the key parameters influencing performance from instrument stability and aberrations to sample stability and dosage tolerance.1
The main advancement driving this change is a method that enables full-field, quantitative imaging of arbitrary samples, regardless of the shape or quality of the illumination.
It is expandable to partially coherent illumination, capable of spectrally resolved and 3D imaging, and eliminates the necessity for image-forming lenses in the system. This approach, known as “Ptychographic Coherent Diffractive Imaging” (CDI) or simply “Ptychography,” has triggered a revolution in imaging science.
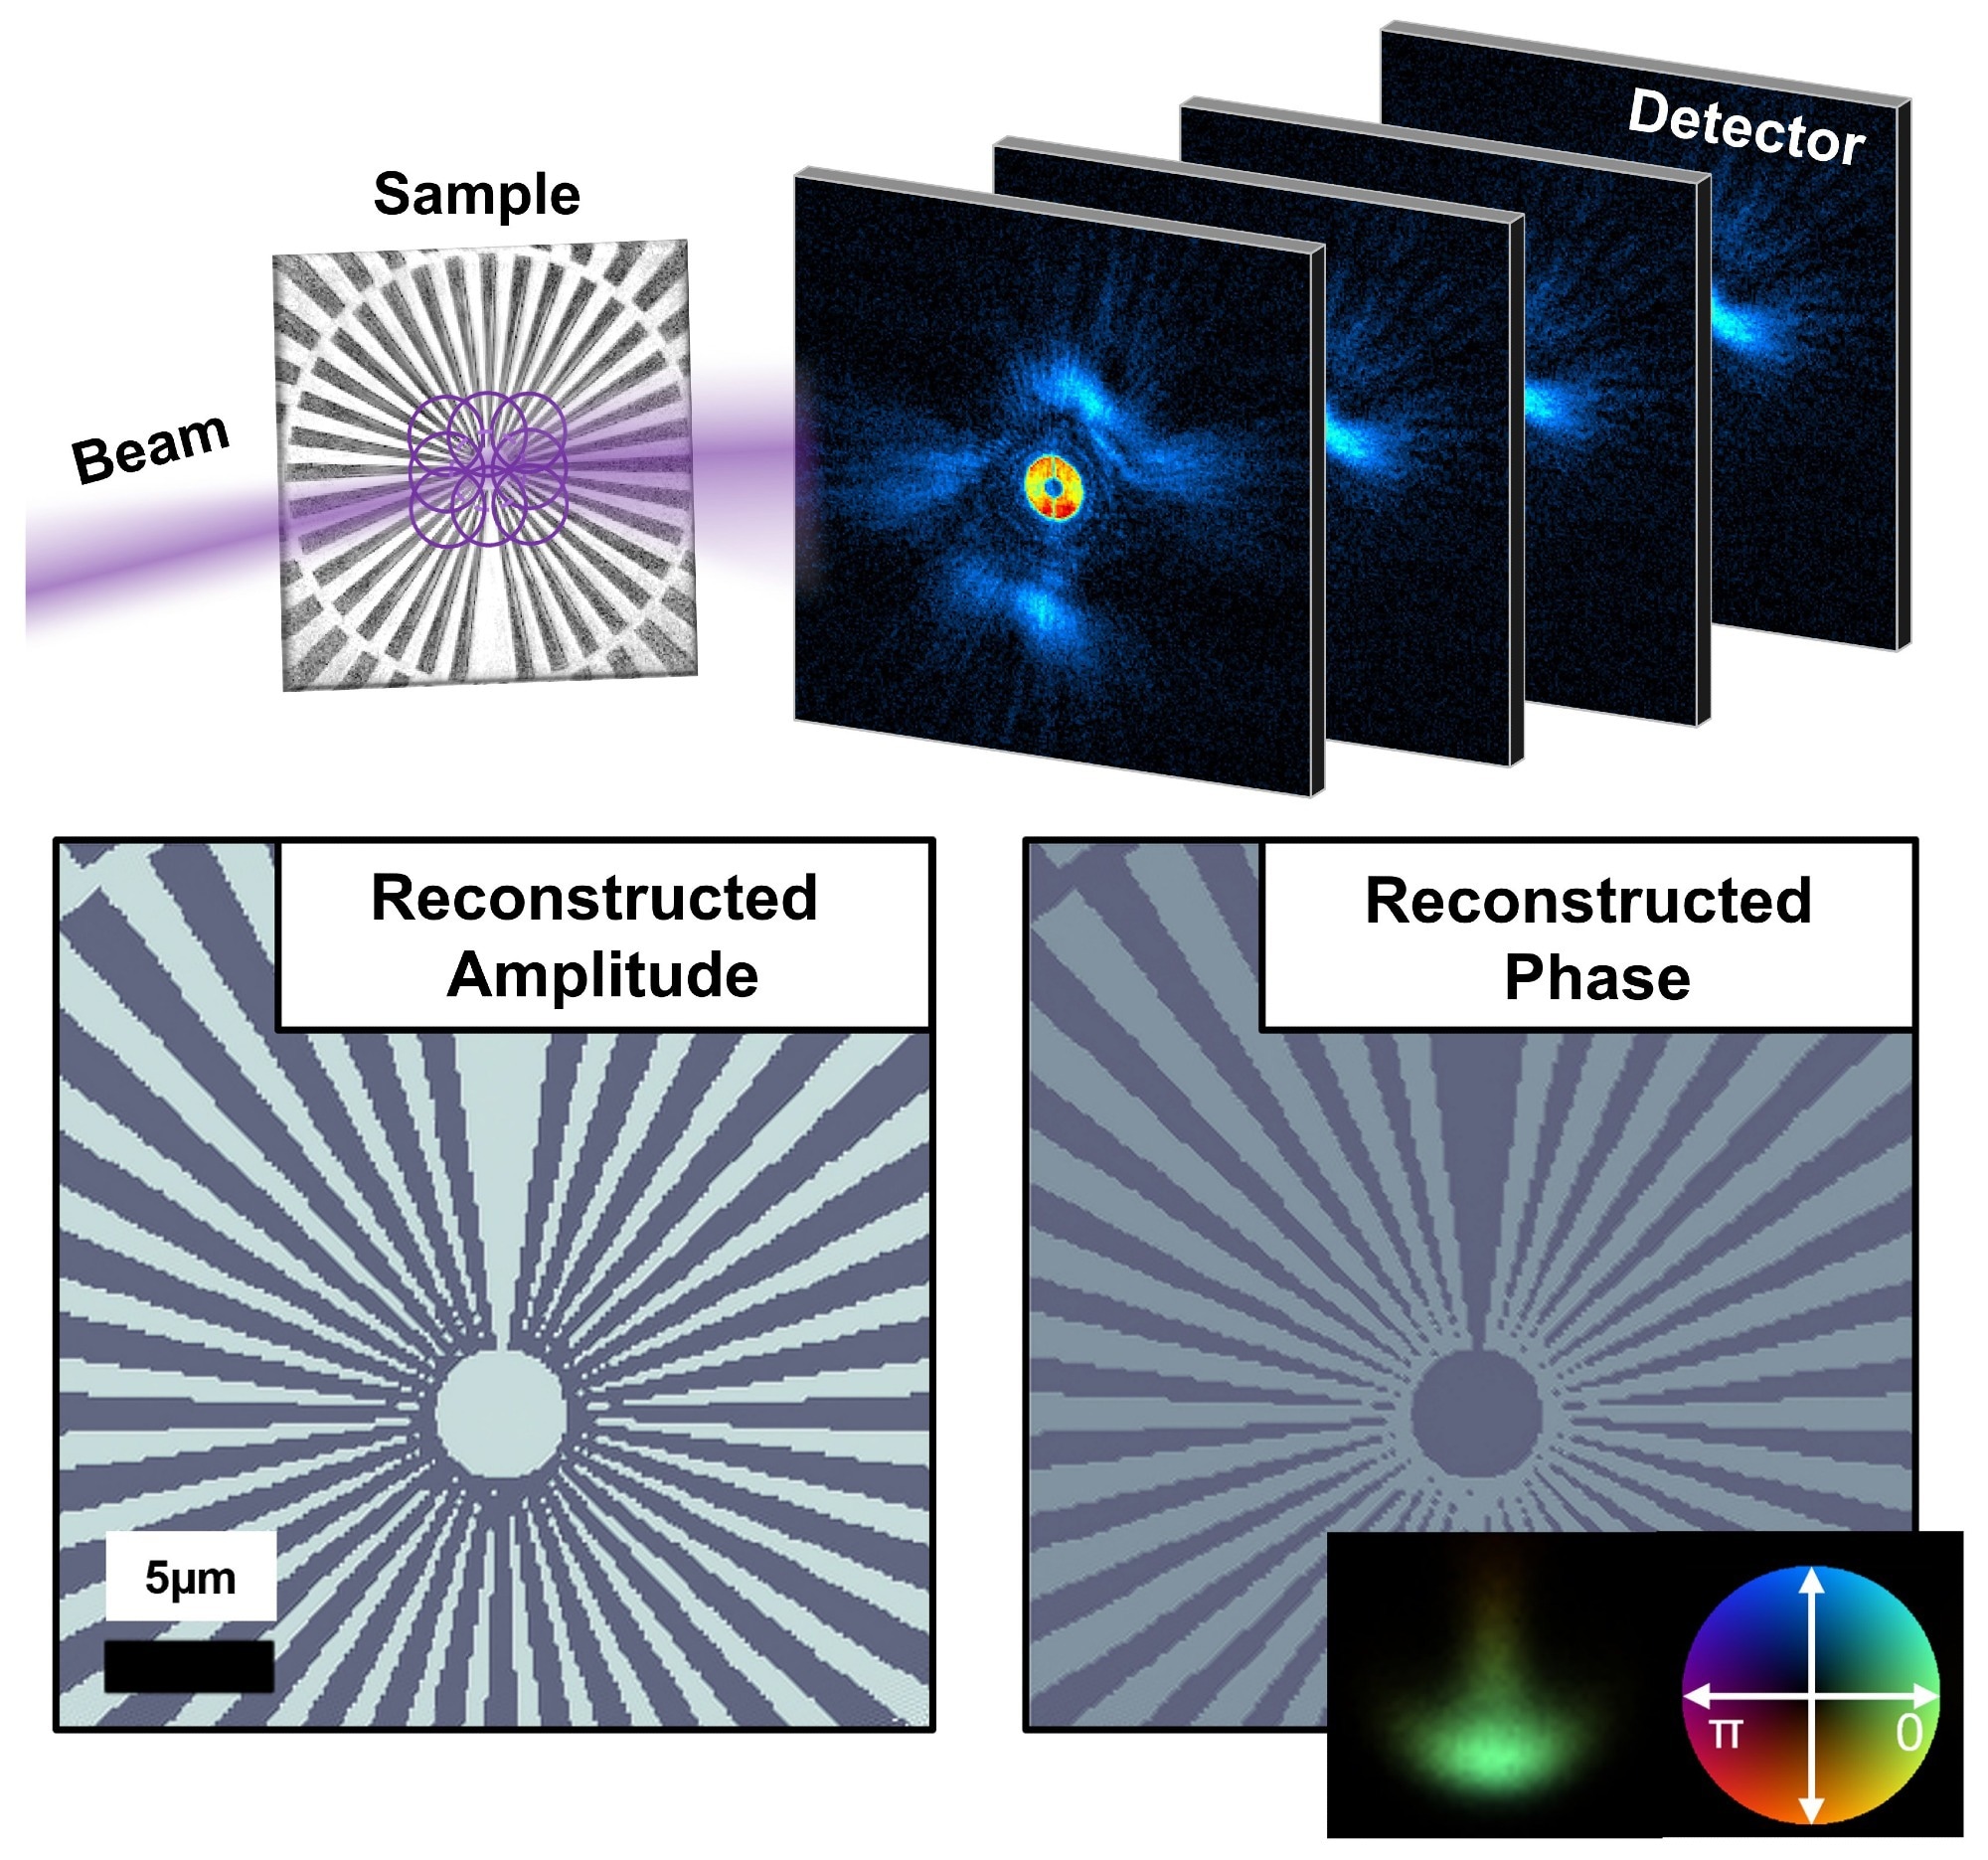
Top: A working principle of a ptychographic scan performed on a simulated 20-nm Nickel Siemens Star, which is deposited on a 200-nm Silicon membrane. The illumination function is focused on the sample, and 2D diffraction patterns are collected from partially overlapping regions in an area-by-area scan. Bottom: Information obtained from the ptychographic reconstruction: amplitude (left) and phase (right), which are separated from the full-field profile of the probing illumination (inset). Image Credit: Dectris Ltd
The Ptychography Imaging Problem
Modern Ptychography is a phase retrieval method that originated in the 1960s with Hoppe’s work on Crystallography.2 The present version of this method employs many adjacent, overlapping scattering measurements to reclaim the sample via iterative, non-linear inversion approaches.
These measurements typically consist of a succession of 2D diffraction patterns acquired by moving a finite-area probe across an area of interest in the sample.
The key conditions for this method are: (i) the overlap between the scanning points, normally between 60% and 80%, and (ii) an upper limit on the beam’s diameter, which ensures proper diffraction sampling during the measurement.
Remarkably, there are no additional limitations on the sample’s geometry, composition, or beam profile. At the end of the phase retrieval procedure, the effects of the sample and probing beam are separated, resulting in two complex-valued images.
The first is a quantitative, complicated transmission—or reflection map—of the sample, while the second is a full-field profile of the probing illumination.
Because of the sample map's complex nature, Ptychography can provide quantitative information on a sample’s amplitude and phase contrasts. The amplitude contrast indicates the sample's projected material composition, whereas the phase contrast provides information about both material and topography.
For thin samples of 2D materials, these images can generate a map of the sample’s composition and morphology, outperforming the image-forming optics employed in TEMs.3
In addition, the wavefront image offers feedback about the performance of the microscope’s beam delivery system and can be utilized directly to analyze the imaging system aberrations.
Additional research has reduced Ptychography’s imaging requirements by combining more complex image generation models into the reconstruction process.
These include various mutually incoherent beam or object modes that explain apparent points of inconsistencies in the recorded data, including beam fluctuations, sample vibrations, and a wide spectrum in the scanning illumination.4,5
Multi-slice propagation techniques can also be utilized in the problem’s forward model to account for various scattering effects caused by a thick sample. This approach reconstructs a 3D structure by concurrently solving for many planes within a sample and extending Ptychography’s imaging capabilities to 3D.6
Ptychography’s Phase Retrieval Algorithms
Ptychography’s rapid ascent coincided with the introduction of the first ptychographic phase retrieval algorithms. These algorithms generally try to locate an unknown object by iteratively enforcing known constraints on the object in reciprocal space.
These may contain the object’s plane (“sample space”) and its 2D Fourier transform, which is the square root of the scatter pattern detected during an experiment (“detector space”).
These techniques have been studied since the 1970s when the well-known Gerchberg-Saxton algorithm was developed.7 However, the game-changer in Ptychography was the transition to a partially overlapping, area-scanning modality, which offers a powerful constraint in sample space.
Essentially, an object's regions illuminated by many distinct but overlapping scanning points must be constant. The object update benefits from the precision offered by adjacent position developments, resulting in faster algorithmic convergence and higher resistance to noise.
After the phase retrieval process is completed, two complex-valued objects are returned. The first is a full-field (amplitude + phase) image of complex object transmission, also known as a reflection map, based on the imaging geometry.
The second is an intricate illumination profile that is used for recording data. Because Ptychographic CDI is reactive to phase and amplitude contrasts, the object image can be transformed into a 2D+1 map containing details about the sample’s material composition and thickness/surface pattern.
On the other hand, the probe’s full-field image enables a thorough analysis of the optical system’s performance. For instance, projecting the complex beam profile onto the Zernike polynomials enables a quantitative assessment of the beam’s aberrations.
The Role of the Detector
Any Ptychographic CDI microscopist will know that the detector is at the center of the process. The detector’s specifications define the overall geometry and parameter space of all other constituents in the system.
Most importantly, the detector must be pixelated. This ensures that the distinctive structure of the 2D diffraction pattern is accurately captured during the phase retrieval inversion process.
In general, Ptychography detectors must address two major issues: (i) they must be highly sensitive to all intensities present in the measurement, and (ii) they have to record a diffraction pattern rapidly enough that the entire dataset is not affected by mechanical fluctuations or beam drift within the imaging system.
Problem (i) concerns a detector’s dynamic range; the highest angle scatter should be observable without saturating the core component of a diffraction measurement, which can result in sensitivity spanning many orders of magnitude in signal strength.
Problem (ii), on the other hand, has a direct connection to the stability of the beam source and varies significantly, depending on the source of an imaging system.
The size and duration of a ptychography dataset can vary based on the required field of view for the image, the scattering strength of the sample under research, and the source’s total flux.
The amount of diffraction patterns required for a full Ptychography dataset remains an open research question. However, approximately 50 patterns are required without any previous understanding of the experiment.
With system stability in the range of minutes, each diffraction pattern must be captured in seconds, from initial exposure to full chip readout. This also necessitates the detector to be highly sensitive to high intensities, as long-term integration over a weak beam is not feasible.
Ptychography is becoming increasingly popular as better detector technology, software, and algorithms become more accessible and sophisticated. Larger diffraction datasets are on their way.
References and Acknowledgments
- Chen, Z., Jiang, Y., Shao, Y.T. et al. Electron ptychography achieves atomic-resolution limits set by lattice vibrations. Science 372, 826-831 (2021)
- Hoppe, W. Beugung im inhomogenen Primärstrahlwellenfeld. I. Prinzip einer Phasenmessung von Elektronenbeungungsinterferenzen. Acta Crystallogr. A 25, 495–501 (1969)
- Jiang, Y., Chen, Z., Han, Y. et al. Electron ptychography of 2D materials to deep sub-ångström resolution. Nature 559, 343–349 (2018)
- Thibault, P. & Menzel, A. Reconstructing state mixtures from diffraction measurements. Nature 494, 68–71 (2013)
- Batey, D. J., Claus, D. & Rodenburg, J.M. Information multiplexing in ptychography. Ultramicroscopy 138, 13–21 (2013)
- Maiden, A.M. & Rodenburg, J.M. An improved ptychographical phase retrieval algorithm for diffractive imaging. Ultramicroscopy 109, 1256–1262 (2009)
- Gerchberg, R.W. & Saxton, W.O. A practical algorithm for the determination of phase from image and diffraction plane pictures. Optik 35, 237 (1972)

This information has been sourced, reviewed and adapted from materials provided by Dectris Ltd.
For more information on this source, please visit Dectris Ltd.