As competition in the battery market intensifies, with new companies and joint ventures vying for market share, it becomes crucial to optimize costs across the production line. Streamlining operations and reducing expenses are essential strategies to maximize the profit margin per battery, ensuring a competitive edge in this rapidly evolving industry.
Image Credit: Thermo Fisher Scientific
Quality plays a key role in this cost-optimization process, as it ensures that changes to the production process do not negatively impact product performance. However, tracking all possible consequences of a process change is no easy feat, and the use of scanning electron microscopes (SEM) has spread in the field with the precise intent of scouting for variations in the product with an instrument that provides visual feedback.
SEM data interpretation is not trivial, and it is often difficult to accurately measure the features of interest in an image, despite this being pivotal to defining reliable pass/fail criteria for the analyzed samples. Multiple technological advancements have helped streamline the information output, and in this article, two use cases will be discussed, where automated image interpretation is used to solidify the consistency of quality inspections and remove the operator's bias from the results.
The first use case centers on optimizing the calendaring process, which is a critical compression step involving the mixture of particles and binder on the tape, performed after the coating and drying steps. The objective here is to achieve the proper packing factor of the cathode material and ensure its adherence to the aluminum tape, ultimately enhancing the battery's energy density.
A poor distribution of particles on the cathode results in an asymmetrical electrode, which negatively impacts the number of cycles a battery can undergo.
We need a cross-section of the cathode to measure the accuracy of the particle distribution and precisely measure the height of the sample on a microscopic scale.
In ideal cases, the sample can be further refined with the use of a broad ion beam polisher to remove the layer of the sample deformed by the cutting process and expose a surface that better represents the sample.
An image segmentation algorithm, software that automates image interpretation, can then be applied to identify the cathode layer and accurately measure its height.
Identification and Measurement of the Active Component Layers of a Cathode
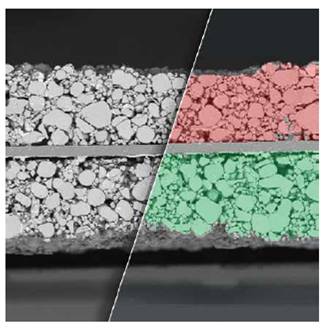
Image Credit: Thermo Fisher Scientific
This sample preparation also enables the validation of the packing density, which maximizes the energy density in the cell, and the identification of cracks formed as a consequence of the calendaring, which impacts the cell lifetime. You can find more on this topic in this article.
To maximize battery energy density, achieving a target packing factor with the cathode particles is essential. Although calendaring can compress these particles closer together, it alone is not enough to ensure the desired packing factor on a production scale.
Monitoring the particle size distribution (granulometry) helps manufacturers validate that there are sufficient particles in each size range to fill the gaps between larger particles.
Due to the size range of the particles and their tendency to create agglomerates, the optical method only partially answers this need, and the use of an SEM can fill this gap.
The particle detection and measurement process, however, needs to be automated, and once again, an image interpretation routine can help make this process flawless. This does not just identify and measure all the particles in the images but refines the results with features like:
- Removing particles that touch an edge
- Identify and distinguish particles that are in contact
- Remove particles that are obstructed by other particles (overlap)
The result is a particle size distribution histogram, providing an accurate description of the sample granulometry.
Detection of Active Cathode Component Particles in the Electrode and Measurement of Particle Size Distribution
This information can be further enhanced by examining the primary particle structure of the precursor material and comparing it with that of the finished cathode material. This analysis allows for the optimization of the curing process in terms of time and temperature, leading to significant cost savings.
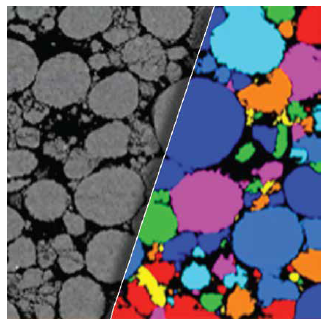
Image Credit: Thermo Fisher Scientific
Detection of Primary Particles in a Close-Up of a Precursor Particle
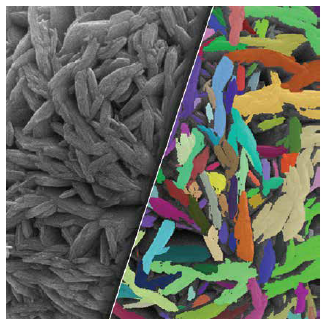
Image Credit: Thermo Fisher Scientific
These cases display how automated image interpretation helps quality experts in manufacturing plants verify the compliance of samples with the process requirements in an automated and reliable way, consequently saving time in the manufacturing process.
If you want to learn more about imaging techniques and automated image interpretation, register for Thermo Fisher's latest webinar, where different imaging techniques will be discussed, as well as how to interpret the resulting data to improve battery quality.
Inspection Report Generation in a Single Click
Thermo Scientific™ Avizo™ Trueput Software for Battery Quality provides a comprehensive suite of workflows designed for the thorough inspection of battery samples. From processing raw images to generating detailed PASS/FAIL reports, Avizo Trueput Software ensures objective results while minimizing operator bias. This standardized approach instills greater confidence in your data, empowering informed decision-making.
The expanding catalog of automated inspections offers a wealth of quality analysis tests, providing valuable insights into widely adopted protocols within your industry. Each test is seamlessly integrated, facilitating efficient implementation into your standard operating procedures for seamless upscaling.
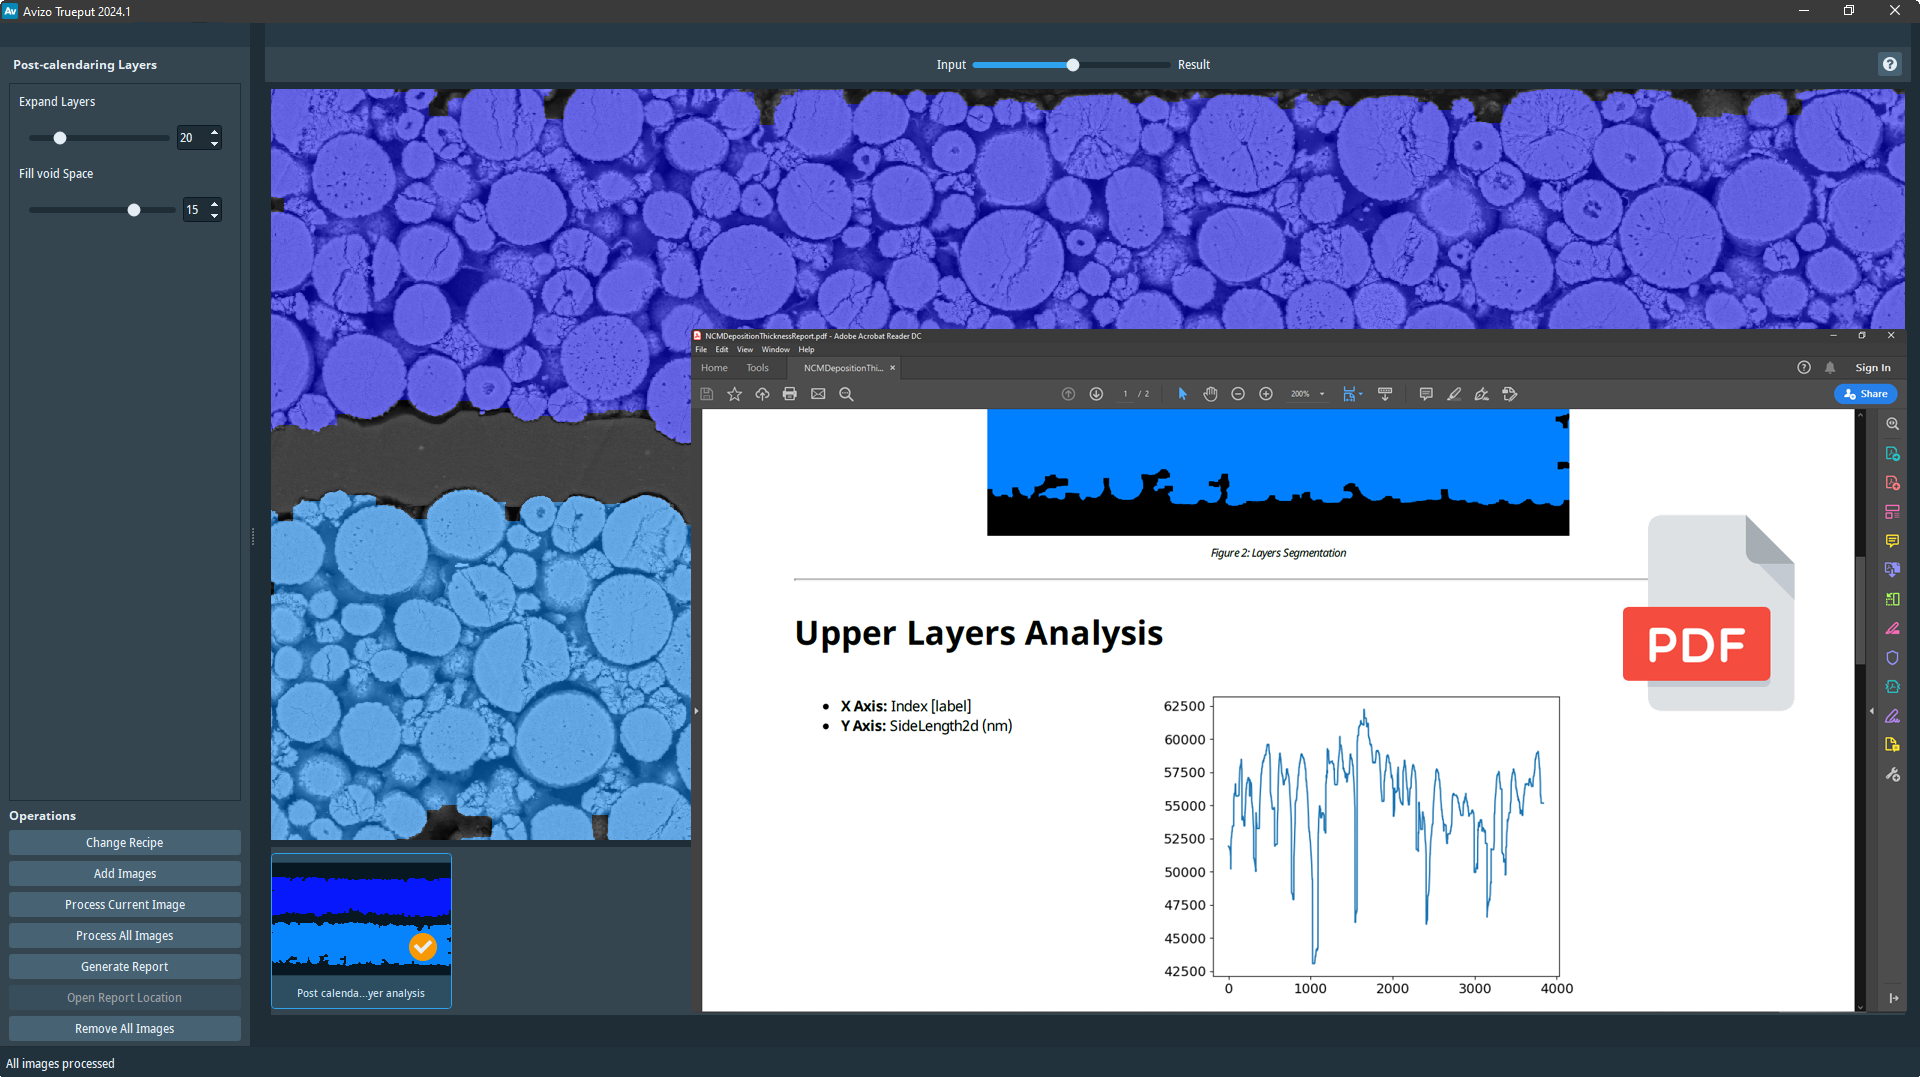
Image Credit: Thermo Fisher Scientific
More SEM Automation Possibilities
Given the inherent complexity of SEM and EDS technology for a high throughput environment, Thermo Fisher focuses on developing various solutions to simplify and streamline the validation of battery quality. From automated image interpretation with Avizo Trueput, real-time chemical information with ChemiSEM, and fully automated particle analyzers using SEM automation software, Perception, Thermo Fisher Scientific offers a variety of solutions for battery quality assessment.
Follow the link below to connect with one of our product experts and validate which of our solutions can best address your challenges.
Learn more about Avizo Trueput Software

This information has been sourced, reviewed and adapted from materials provided by Thermo Fisher Scientific - Software.
For more information on this source, please visit Thermo Fisher Scientific - Software.