The synthetic aviation fuels (SAF) industry offers an alternative to traditional fossil-based aviation fuels sourced from crude oil by utilizing renewable and sustainable feedstocks.
This industry is predicted to expand rapidly over the next decade due to laws such as the EU's ReFuelEU plan and the United States’ Sustainable Aviation Fuel Grand Challenge, which encourage the utilization of sustainable aviation fuels that minimize air quality effects and greenhouse gas emissions.
Many existing recognized SAF processing procedures reduce or eliminate total aromatics and sulfur content, resulting in lower particle and sulfur-oxide emissions.
However, a certain level of aromatic content remains necessary for retaining the appropriate freeze points, viscosity, and polymeric sealing properties in a jet fueling system. Therefore, it is critical to balance understanding of a new fuel's physical properties, energy content, and emissions profiles as well as the individual components in its chemical makeup that affect these bulk properties.
For novel fuels to be approved for use, extensive characterization is required to meet regulatory standards, such as ASTM D7566 and ASTM D1655, which specify fuels that can be co-processed and blended for commercial use in the United States.
Comprehensive two-dimensional gas chromatography (GCxGC) and time-of-flight mass spectrometry (TOFMS) can generate high-quality data required for a deeper understanding of the composition of synthetic aviation fuels and speed up the certification process.
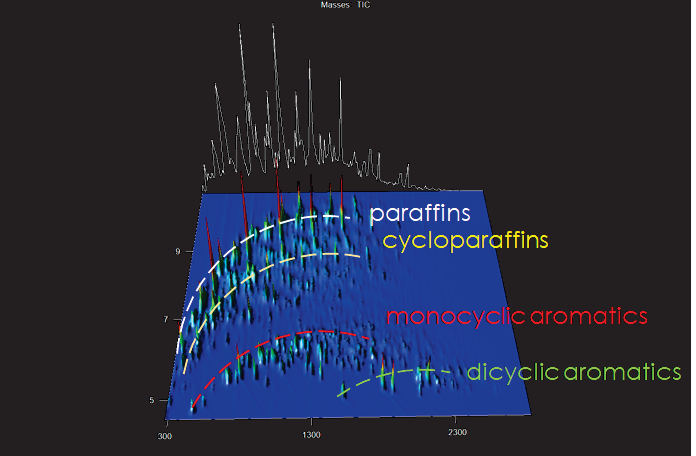
Figure 1. GCxGC 3D surface plot of commercial aviation turbine fuel with Total Ion Chromatogram (TIC) shown. Reconstructed trace of what a single dimension of GC separation would have looked like is shown in white. Elution bands of paraffins (white), cycloparaffins (yellow), monocyclic aromatics (red), and dicyclic aromatics (green) are indicated by dotted lines. Image Credit: LECO Corporation
The organized character of GCxGC chromatograms enables rapid identification of compound classes, which is critical for detecting the ingredients of synthetic aviation fuel.
With hundreds of compounds present, the complexity of the data necessitates straightforward visualization and orientation for interpretation, which GCxGC delivers in elution bands of similarly structured analytes, as illustrated in Figure 1.
Separation by multidimensional chromatography alone, however, is insufficient to isolate specific species and enable reliable identification.
For further compound class differentiation, the ability to plot individual mass channels that correspond to characteristic fragment masses can provide clarity and better define the elution space, as shown in Figure 2, which depicts the common classes of interest for a sample of conventional jet fuel.
While all of these classes exist to some extent in traditional fossil-fuel-based aviation fuels, the innovative technologies utilized in the manufacturing of synthetic aviation fuels produce a completely different distribution than previous classes.
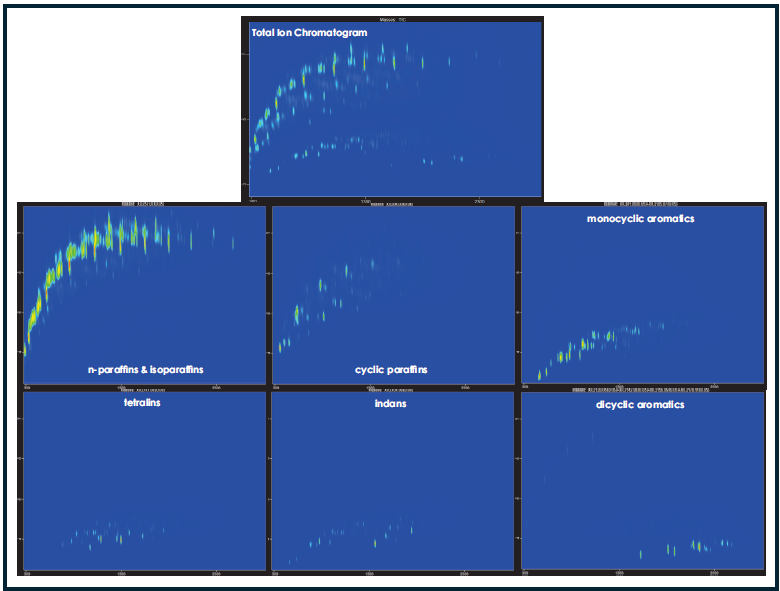
Figure 2. GCxGC contour plots of traditionally sourced commercial aviation turbine fuel with each plot displaying a different set of masses. Characteristic fragmentation masses are plotted for each class of compound: m/z 57.07 for n-paraffins and isoparaffins; m/z 96.09 for cyclic paraffins with a 6-carbon-ring based structure; m/z 104.06 for indans; m/z 117.05 for tetralins; m/z 91.05 and m/z 105.07 for alkylbenzenetype monocyclic aromatics; m/z 128.06, m/z 142.08, m/z 156.09, and m/z 170.11 for alkylnaphthalene-type dicyclic aromatics. Image Credit: LECO Corporation
Experimental
Table 1 displays the thermally modulated GCxGC and TOFMS parameters used to test various aviation fuel samples diluted with hexane at a 100:1 ratio. Data was processed using ChromaTOF® software, which included automated Peak Find and Library Search.
Peaks were automatically deconvoluted and compared with the NIST23 spectral library. Classification templates were created by combining the analytes in individual samples with a gravimetric reference mix that included alkane, cycloalkane, monoaromatic, and diaromatic compounds.
Table 1. Acquisition Parameters. Source: LECO Corporation
| Gas Chromatograph |
LECO QuadJet™ Thermal GCxGC |
| Injection |
1 μL liquid injection, split 100:1 @ 300 °C |
| Carrier Gas |
He @ 1.0 mL/min, constant flow |
| Column One |
Rxi-17SilMS, 30 m x 0.25 mm ID x 0.25 μm coating
(Restek, Bellefonte, PA, USA) |
| Column Two |
Rxi-5MS, 1.45* m x 0.25 mm ID x 0.25 μm coating
*1.05 m coiled in 2nd oven |
| Temperature Program |
0.5 min at 40 °C, ramped 3.0 °C/min to 300 °C, hold for 5 min |
| Secondary Oven |
+15 °C relative to primary oven |
| Modulator Temperature |
+15 °C relative to primary oven |
| 2nd Dimension Separation Time |
8 s, hot pulse time 2.40 s |
| Transfer Line |
350 °C |
| Mass Spectrometer |
LECO Pegasus BTX |
| Ion Source Temperature |
250 °C |
| Mass Range |
35-900 m/z |
| Acquisition Rate |
200 spectra/s |
Results and Discussion
While differences in composition between traditional jet fuels are relatively subtle, with slightly varying ratios of specific compounds, as shown in Figure 3, the variety of processes currently approved for synthetic aviation fuels used as blending components results in contour plots with much more apparent differences.
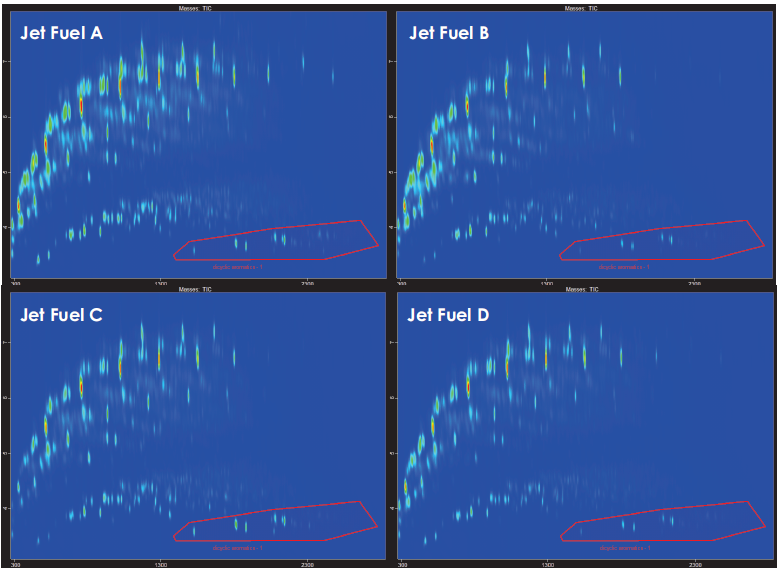
Figure 3. GCxGC contour plots comparing the TIC of four different traditional jet fuels A-D. Distribution of hydrocarbons generally follows the expected trend for traditional fossil-derived fuels, with a wide range of paraffins and aromatic compounds present. Examples of slight variations in the speciation of each fuel, for example, in the dicyclic aromatic region, can be noted in the bottom right of each plot, with jet fuel A and jet fuel C containing a higher amount of naphthalene relative to the methyl- and dimethyl- naphthalene isomers. Image Credit: LECO Corporation
The Fischer-Tropsch (FT) catalytic chemical process transforms carbon monoxide and hydrogen from synthesis gas mixtures produced by woody biomass or coal into bigger hydrocarbons, the formations of which are primarily determined by the catalyst type and reaction temperature.
Figure 4 compares low-temperature Fischer-Tropsch Synthetic Paraffinic Kerosene (LTFT-SPK) and high-temperature Fischer-Tropsch Synthetic Paraffinic Kerosene (HTFT-SPK), demonstrating that higher temperatures tend to shift the reaction toward products with more branching, lower carbon number, and higher hydrogenation.
Paraffins are the major species in FT-SPK, and according to ASTM D7566 Annex A1, they are now authorized in synthetic aviation fuel mixes of up to 50%.
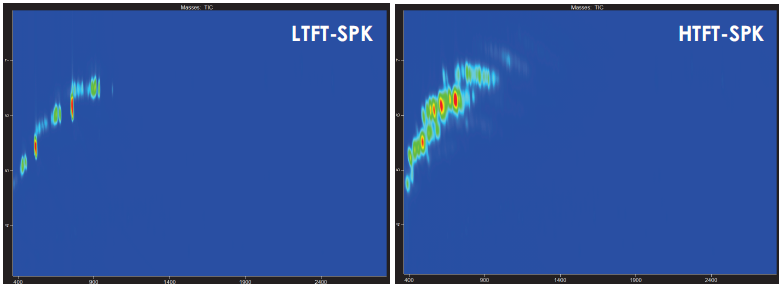
Figure 4. GCxGC contour plot comparing the TIC of low-temperature to high-temperature Fischer-Tropsch derived synthetic paraffinic kerosene, demonstrating the greater prevalence of isoalkanes and other branched paraffins in the HTFT-SPK compared to the n-alkane-dominated LTFT-SPK. Image Credit: LECO Corporation
Figure 5 presents an example of the addition of aromatics that converts the FT-SPK product to FT-SPK/A, which is also allowed in blends of up to 50% according to ASTM D7566 Annex 4. A more significant portion of the FT-SPK/A sample comprises monocyclic aromatic hydrocarbons.
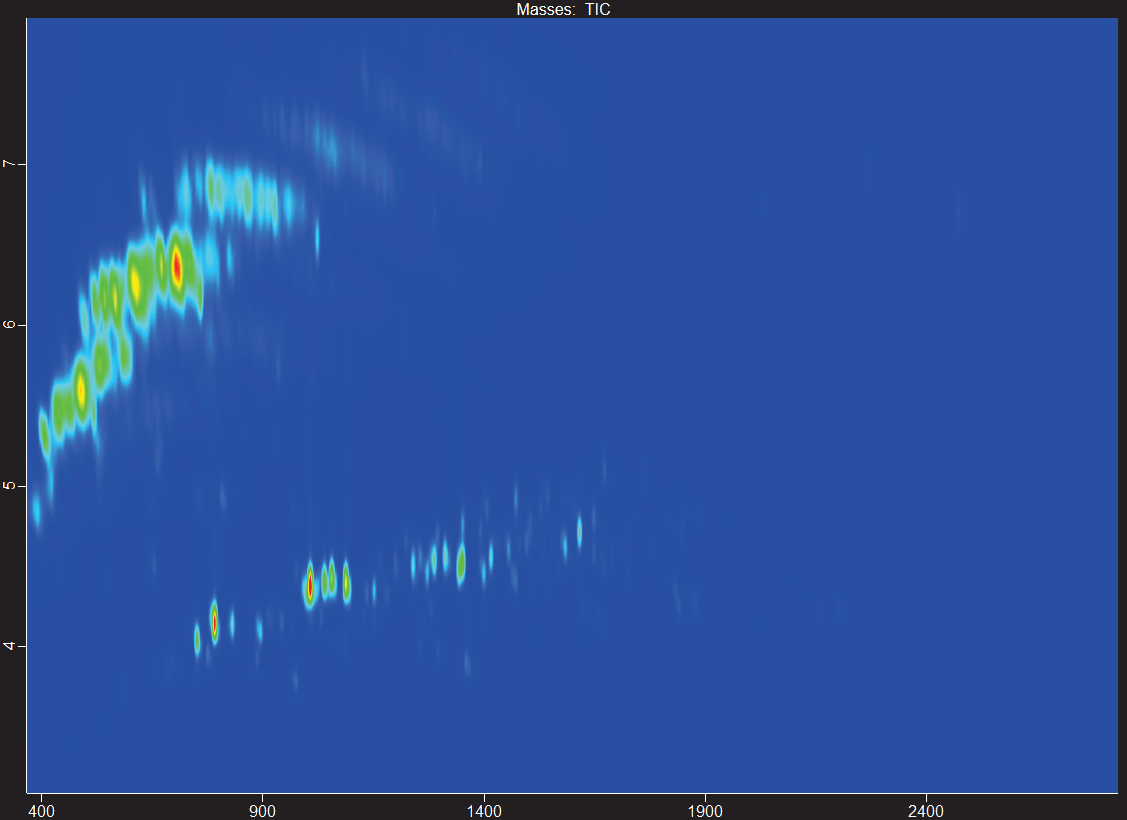
Figure 5. GCxGC contour plot showing high-temperature Fischer-Tropsch blend with aromatics (HTFT-SPK/A). Image Credit: LECO Corporation
While contour plots are useful for visualizing the bulk composition of samples, the benefits of GCxGC go beyond simple visuals.
The ability to efficiently deconvolve peaks and produce cleaner spectra for better library matches is enhanced by the increase in chromatographic resolution between different chemical species compared to a similar chromatogram area in a single dimension of GC separation alone.
In the HTFT-SPK/A sample, a zoomed-in section of the chromatogram reveals three peaks with the same first-dimension separation time: branched paraffin, linear alkane, and isoalkylbenzene.
The second dimension of separation allows for clear chromatographic resolution across peaks, resulting in library similarity scores of more than 850/1000 for each identification, as shown in Figures 6-8.
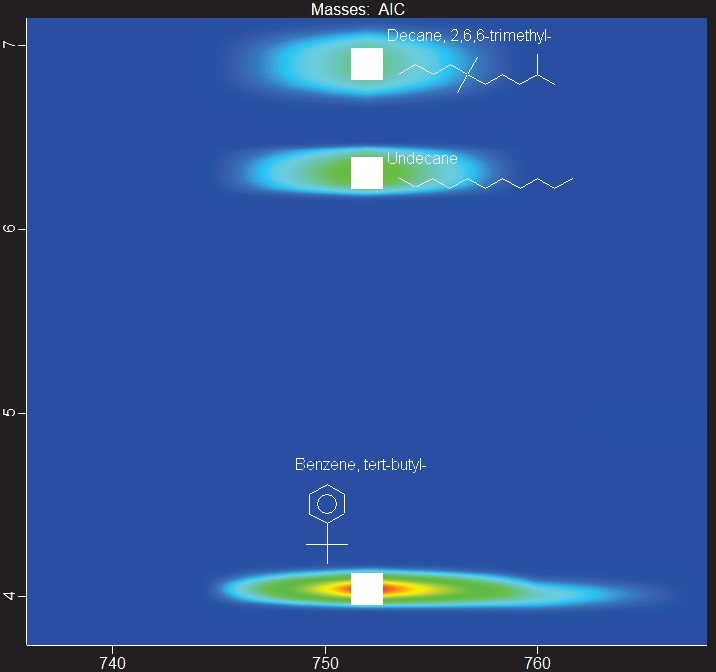
Figure 6. Zoomed-in section of GCxGC contour plot of HTFT-SPK/A showing the resolution of three distinct peaks that share the same first-dimension retention time, automatically labeled with putative identification and structure. Image Credit: LECO Corporation
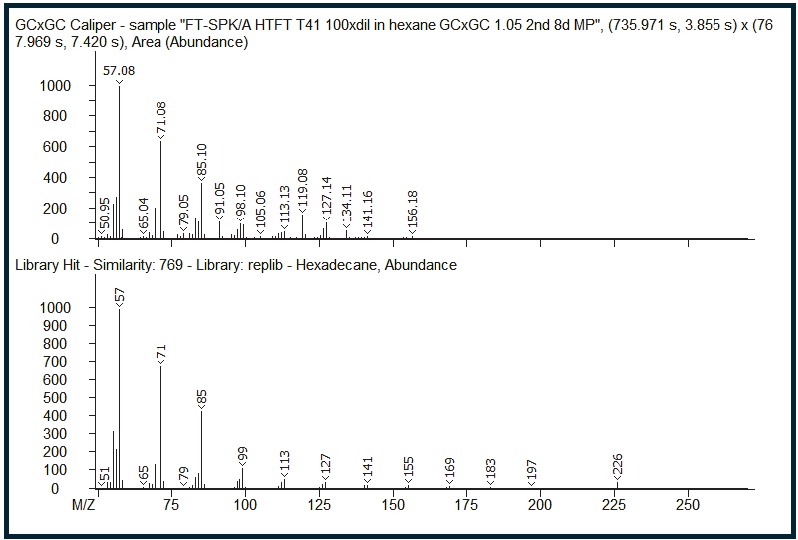
Figure 7. GCxGC caliper spectra of the zoomed-in region illustrates what the mass spectrum would have looked like with only a single dimension of GC separation (top), along with the corresponding library hit (bottom). The identity of the signal at that first-dimension retention time is incorrectly assigned as hexadecane. Image Credit: LECO Corporation
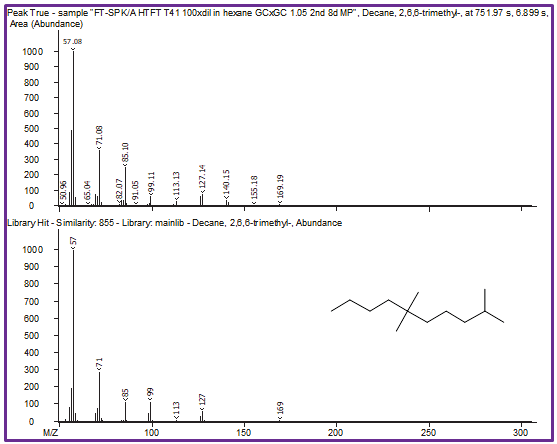
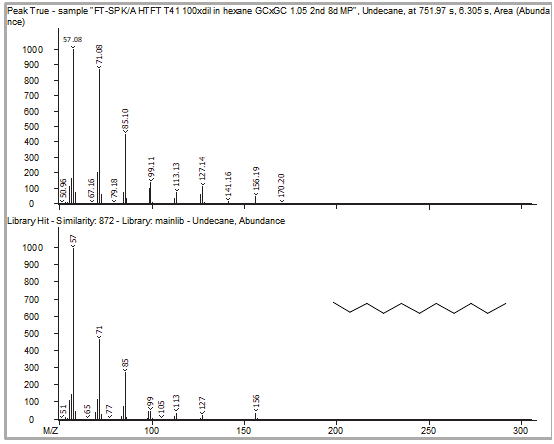
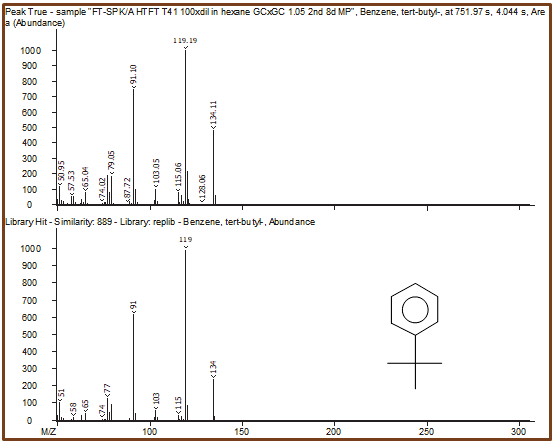
Figure 8. Peak True spectra of each peak identified in the region previously shown in Figure 6 are shown with corresponding library spectra. Because of the second dimension of chromatographic separation, cleaner deconvoluted spectra lead to better, more-accurate identification of each individual peak. Image Credit: LECO Corporation
Figure 9 shows another example of this: four analytes from distinct compound classes coelute in the same first dimension time but are resolved in the second dimension, with strong library matches and similarity scores of more than 850/1000.
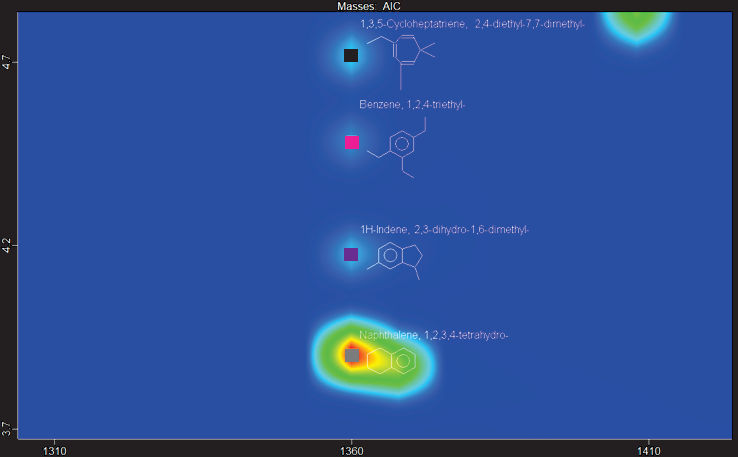
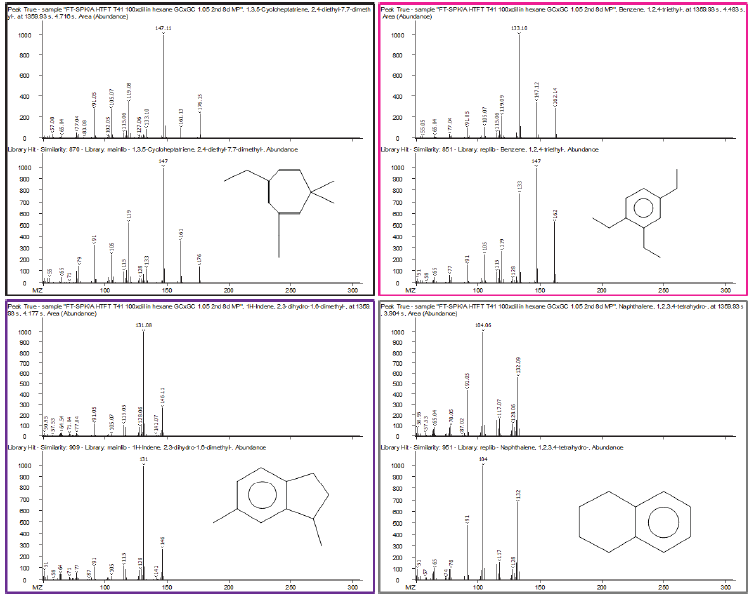
Figure 9. (Top) Zoomed-in section of contour plot of HTFT-SPK/A sample showing a region with four peaks chromatographically resolved by GCxGC in the same first-dimension retention time. Peak True spectra for each peak identified are shown with corresponding library spectra, with each peak belonging to a different structural class. Image Credit: LECO Corporation
While the combination of many dimensions of chromatography and mass spectrum information may appear daunting at first, the ChromaTOF suite of software tools makes it simple to filter through the rich data and target specific analytes of interest.
The automated Peak Find with a deconvolution technique was used to identify over 11,000 features in a sample of typical aviation fuel.
Figure 10 demonstrates how easy it is to sift through the wealth of data and focus on peaks with high library match similarity scores and interesting characteristics (such as heteroatomically substituted sulfur-containing compounds), which may be important for preventing catalyst poisoning or understanding emissions profiles.
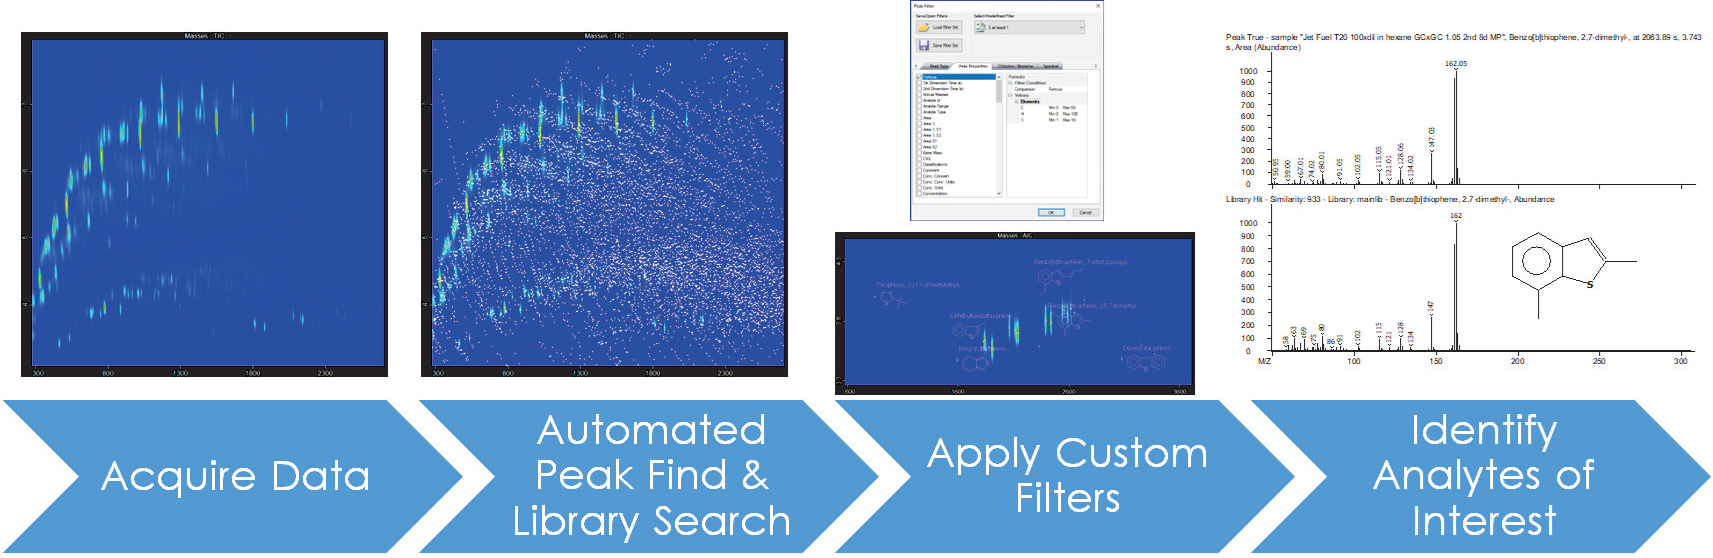
Figure 10. Data processing workflow for semi-targeted analysis of traditional aviation fuel, showing the power of custom peak filtering for narrowing focus to potential analytes of interest. Image Credit: LECO Corporation
Conclusion
Thanks to its increased chromatographic separation from GCxGC and rich spectrum information from TOFMS, the Pegasus BTX 4D is capable of both broad and comprehensive characterization of aviation fuels.
From tracing traditional hydrocarbon elution patterns to spectral identification of heteroatom-containing species using built-in software tools, ChromaTOF can simplify understanding the composition of future fuels for certification.
References
- https://aviationweek.com/business-aviation/aircraft-propulsion/viewpoint-bio-based-aromatics-point-way-burning-100-saf
- https://www.marketsandmarkets.com/Market-Reports/sustainable-aviation-fuel-market-70301163.html
- https://afdc.energy.gov/fuels/sustainable_aviation_fuel.html
- https://aviationweek.com/special-topics/sustainable-aviation-fuel/saf-market-worth-13112-billion-2033
- https://guidehouseinsights.com/reports/market-outlook-for-sustainable-aviation-fuels
- https://www.netl.doe.gov/research/carbon-management/energy-systems/gasification/gasifipedia/ftsynthesis
- https://skynrg.com/sustainable-aviation-fuel/technology-basics/

This information has been sourced, reviewed and adapted from materials provided by LECO Corporation.
For more information on this source, please visit LECO Corporation.