Ginger essential oil (ginger EO) is derived from the plant's rhizome and has been prized for generations due to its fragrant, medicinal, and culinary characteristics. Ginger oil has a long history, extending back to ancient China and India, and is valued for its various applications and therapeutic advantages.
Ginger essential oil is known for its warming, spicy aroma and is frequently used in aromatherapy to treat nausea, promote digestion, and reduce muscle pain. In culinary uses, it adds depth and complexity to meals, particularly in Asian and Indian cuisines.
Ginger oil is also prized in skincare due to its anti-inflammatory and antioxidant characteristics, which promote healthy skin and hair.
Ginger oil has a complex chemical composition, including bioactive chemicals like gingerol, shogaol, and zingiberene. Gas Chromatography-Mass Spectrometry (GC-MS) analysis is routinely used to determine the quality and purity of ginger oil, ensuring that it fulfills industrial and regulatory standards.
Differentiating essential oil grades is critical in the perfumery, flavor, and food industries for various reasons, including quality, consistency, safety, and overall product efficacy.
For example, high-quality EOs are frequently pure, unadulterated, and extracted using meticulous methods to preserve their natural properties. In contrast, low-quality EOs may be diluted, adulterated, or extracted using less refined methods, potentially compromising their scent and taste profiles and therapeutic qualities.
In this regard, fragrance businesses frequently require the ability to quickly and accurately assess EO quality characteristics.
This article demonstrates how to convert a Helium-based method to a quick and reliable hydrogen-based approach using LECO's new BTX GC-TOFMS instrument.
This mass spectrometer has a broad dynamic range and sensitivity at Pegasus low femtogram levels, enabling the simultaneous detection of abundant and trace components without sacrificing detail.
In addition, ChromaTOF Sync software was utilized to differentiate between several grades of ginger EO and identify® markers for each of them.
Experimental
Four ginger EO grades were examined. Before injection, the samples were diluted to 0.1% (v/v) in hexane. n-Alkane standards (C7-C30) were diluted to 10 mg/L in hexane and examined using the same chromatographic conditions to calculate linear retention indices (RIs).
Table 1 shows the experimental parameters used, including the gas chromatographic parameters, to develop the conventional helium (He) and improved hydrogen (H2) techniques.
Table 1. Instrumental parameters applied for the He- and H -based methods. Source: LECO Corporation
| GC |
Agilent 8890 |
| Injector |
1 μl split 200:1 at 250 °C |
| Carrier Gas |
He 1.4 mL/min |
H2 1.26 mL/min |
| Column |
Rxi-5Sil MS 30 m x
0.25 mm ID x
0.25 μm f.t. |
Rxi-5Sil MS 20 m x
0.18 mm ID x
0.18 μm f.t. |
| Oven Program |
50 °C (0.1 min);
ramp: 8.5 °C/min to 280 °C (5 min) |
50 °C (0.1 min);
ramp: 20 °C/min to 280 °C (5 min) |
| Transfer Line |
280 °C |
280 °C |
| MS |
LECO Pegasus BTX TOFMS |
| Ion Source Temp |
250 °C |
| Mass Range |
40 to 400 m/z |
| Acquisition Rate |
10 spectra/s |
20 spectra/s |
Results
One of the primary reasons for using H2 carrier gas in gas chromatography is its superior efficiency at higher linear velocities compared to He.
This is owing to the first's lower viscosity and, thus, higher diffusivity than He. As a result, H2-supplied approaches provide faster analysis times while maintaining comparable chromatographic resolution values.
Figure 1 compares the He method to the analogous translated H2 approach. The method translation strategy is illustrated in and uses Restek's EZGC method translator Application Note 203-821-651 tool.
Based on the R.T. of Gingerol (CAS: 23513-14-6), using H2 carrier gas shortened analysis time by approximately 60% compared to the initial, He-supplied approach.
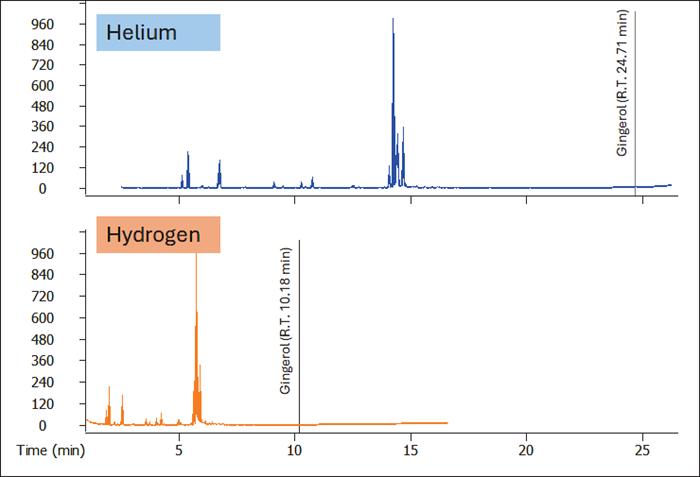
Figure 1. Comparison between a conventional He-optimized GC-MS method (blue trace) and the H -translated one (orange trace). Image Credit: LECO Corporation
Figure 2 shows how the chromatographic resolution is maintained and improved when the chromatographic technique is converted to an H2 carrier gas.
The top (light grey) shows the resolution between Bornyl acetate (CAS: 76-49-3) and Undecan-2-one (CAS: 112-12-9), while the bottom (dark blue) highlights the resolution between (E)--Farnesene (CAS: β 18794-84-8) and Sesquisabinene (CAS: 58319-04-3).
In both situations, the H2-supplied approach performed better chromatographically than the He-supplied one.
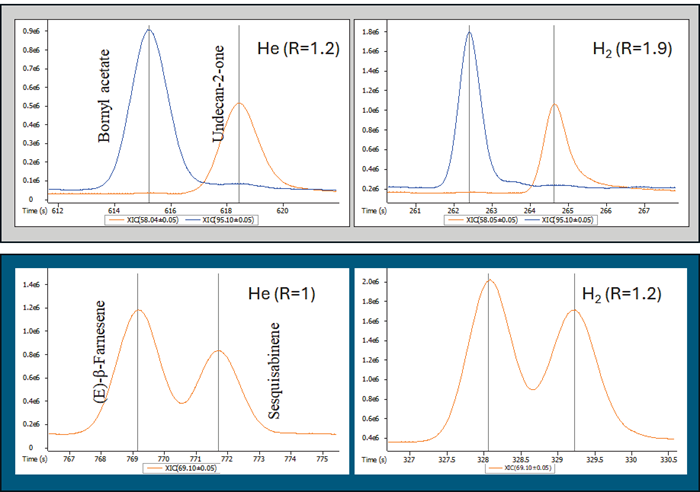
Figure 2. Chromatographic resolution comparison between He- and H -supplied GC methods. Image Credit: LECO Corporation
Table 2 shows the new TOF mass spectrometer's spectral quality while employing He or H2 as a carrier gas. Several example compounds were chosen, and their library scores were compared using the same mass spectrum library, specifically the NIST MS database (Table 2).
Historically, the spectral quality of compounds ionized in the presence of H2 carrier gas was lower than that obtained with He carrier gas, owing to the components' reactivity in the ionization source, which can result in distorted spectra with lower similarity and/or misidentifications due to chemical reactions generating entirely different substances.
Table 2 also demonstrates that the library scores are highly comparable, allowing for confident identification with any carrier gas.
Table 2. He vs H mass spectral quality comparison. Source: LECO Corporation
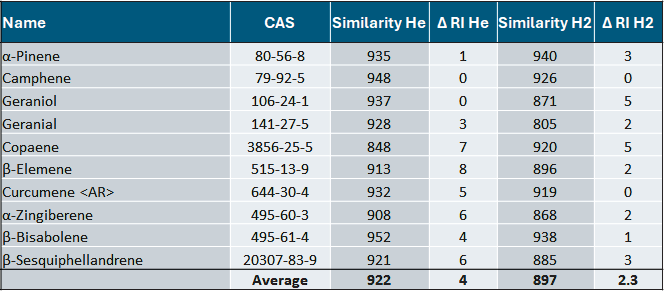
Figure 3 depicts the mass spectral fragmentation of Gingerol (CAS: 23513-14-6) utilizing He and H2 carrier gases, with the NIST library spectrum as a reference. As shown, no major variations in the fragmentation profiles were obtained using He and H2 carrier gases.
This is due to the unique open design of LECO's StayClean® Ion Source, which does not interfere with ionization in the presence of H2 carrier gas. Further details on the ionization source can be found in Application Note: 203-821-569
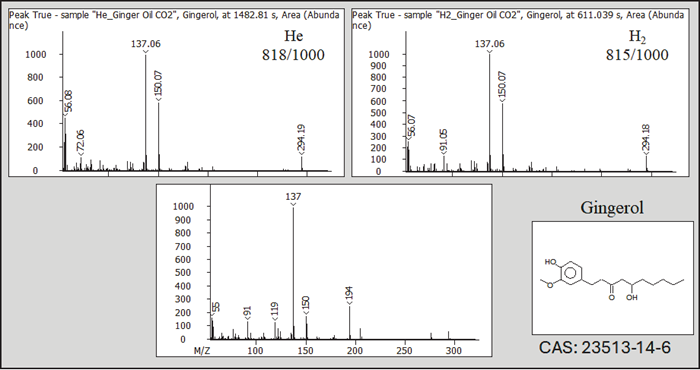
Figure 3. Example of EI MS fragmentation using He and H carrier gas. Image Credit: LECO Corporation
Essential oil grades are critical to the essential oil industry because they substantially impact the quality, consistency, and safety of finished fragrance goods. ChromaTOF Sync software was used to easily identify markers that distinguished the four EO grades measured.
ChromaTOF Sync is a data processing program that collects peak information from collections of samples using automatic peak discovery and deconvolution of high-quality TOFMS data.
Figure 4 shows the Principal Component Analysis (PCA) results and a heat map with information for some of the differentiating components.
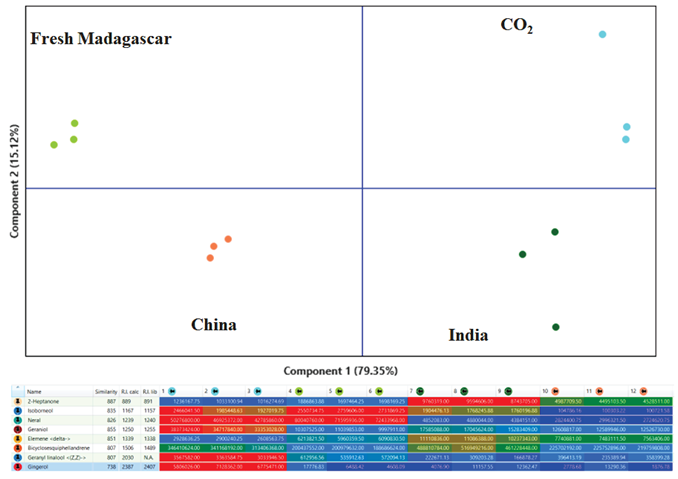
Figure 4. Principal Component Analysis (PCA) scores plot (top) displaying clustering of the Ginger EO samples according to their origin. The heatmap (bottom) allows one to quickly highlight differences across the samples set. Image Credit: LECO Corporation
Figure 5 (a–c) depicts three examples of distinguishing components, along with mass spectrum information and odor characteristics. Their identification was acquired by comparing the deconvoluted mass spectra in ChromaTOF Sync to the NIST MS database using RI calculation and filtration.
The accessibility of data interpretation makes ChromaTOF Sync an effective instrument for exploring EO compositions and distinguishing EO grades. Moreover, the relationship to the original data is never lost because the user can always investigate it and change factors like integration, hit assignment, etc.
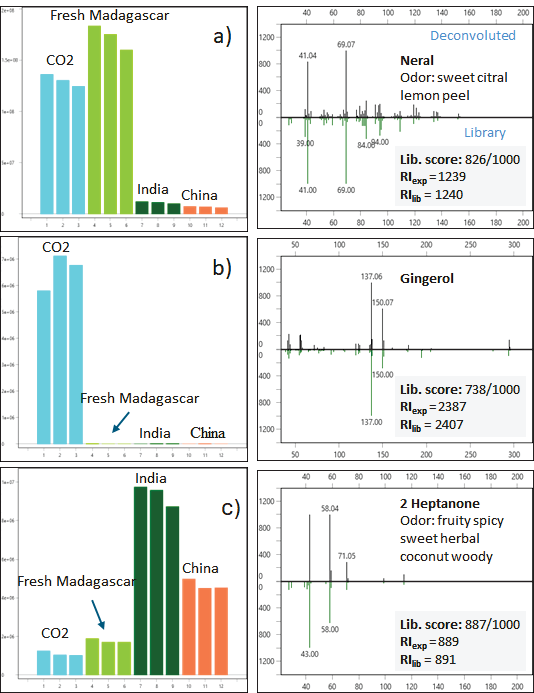
Figure 5 (a to c). Three examples of marker components, respective the different ginger oil grades, with mass spectra details and odor characteristics. Image Credit: LECO Corporation
The BTX's combination of high sensitivity and full mass range non-target data can also uncover more important and distinguishing analytes, even when they are present in trace amounts. ChromaTOF software and deconvolution are also required to extract these features from coelutions and interferences.
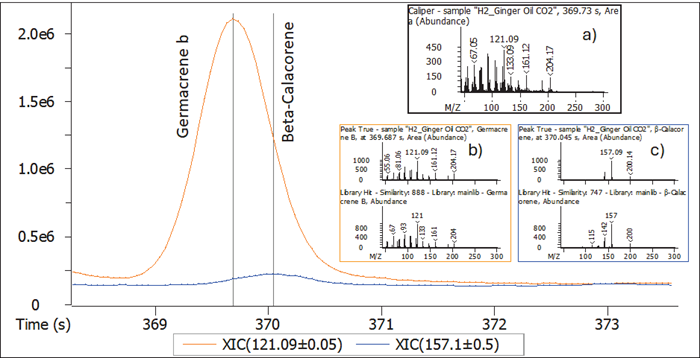
Figure 6. Detection, deconvolution, and identification of 2 coeluting, trace level components. Image Credit: LECO Corporation
For example, a further in-depth study of the CO2 ginger oil grade indicated the existence of two fragrance-active species at trace levels (Figure 6). Germacrene b, Beta-Calacorene coelute, and the TIC mass spectra (6a) are challenging to match in the library due to the ion cross-mixture.
However, deconvolution produced distinct mass spectra with two components (6b,c), allowing for more confident library matching.
Conclusions
This article shows how the BTX GC-TOFMS is a good choice for quick analysis of EOs Pegasus with H2 carrier gas. The results show that employing H2 has no negative impact on chromatographic performance or mass spectral quality. A 60% reduction in runtime was obtained, resulting in higher daily throughput.
Image Credit: LECO Corporation
In addition, the ChromaTOF Sync software tool successfully grouped the samples depending on their origin and quality, allowing ChromaTOF to identify distinguishing characteristics.
The output information from ChromaTOF Sync enables more informed use of raw materials in creating novel perfumes and increases trust in assessing routine samples.

This information has been sourced, reviewed and adapted from materials provided by LECO Corporation.
For more information on this source, please visit LECO Corporation.