Understanding the scent profiles of herbs and spices, as well as other natural goods, is critical in the flavor, fragrance, and food industries to ensure the quality of raw materials and finished products.
The ability to thoroughly and efficiently screen diverse materials is critical for producers seeking to secure their supply chains and brands.
Understanding and controlling material properties, quality, and authenticity improves product development and production optimization, allowing businesses to address problems more quickly and respond to consumer and market expectations.
Gas chromatography (GC) can assess the volatile and semi-volatile profiles of natural raw materials, such as herbs. Time-of-flight mass spectrometry (TOFMS) is suited for this type of extremely complex investigation due to its wide mass range and quick data-collecting capabilities.
The Pegasus BTX GC-TOFMS system collects large data sets, allowing for improved detection and identification of key fragrance species.
However, comparing analytes and their trends across complicated sample sets may be time-consuming. ChromaTOF Sync software makes this easier by automatically deconvoluting and statistically processing many data sets fast and efficiently, resulting in an insightful output of distinguishing sample properties and characteristics.
This article investigated the scent profiles of dried thyme from several geographical origins (France, Morocco, Poland, and Spain) to better understand the similarities and differences in chemical profiles that may influence their aroma.
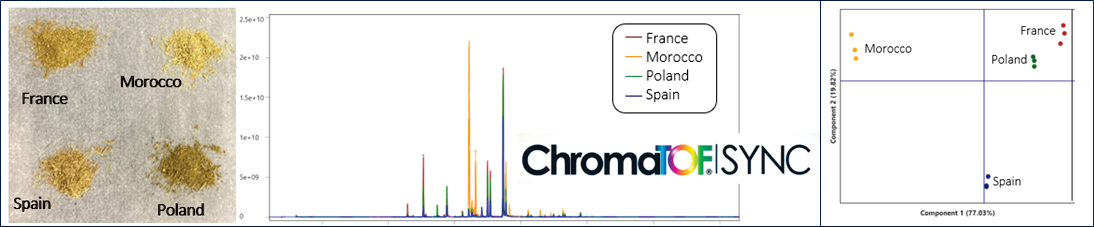
Figure 1. The Pegasus BTX and ChromaTOF Sync are combined to compare dried thyme from four different countries. Image Credit: LECO Corporation
Experimental
Thyme samples from France, Morocco, Poland, and Spain were examined in triplicate using HS-SPME and GC-TOFMS (Figure 1). For each replicate, 50 mg of dried thyme was placed in a 20 mL headspace vial.
The samples were incubated in the LPAL-3 agitator for 2 minutes at 40 degrees Celsius before being extracted for 5 minutes at the same temperature using a tri-phase SPME fiber (PDMS, DVB, CWR).
Table 1 shows the method details. The same methods were also used to evaluate an alkane standard and determine retention index (RI) values.
Table 1. Instrument (Pegasus BTX) Conditions. Source: LECO Corporation
| Auto Sampler |
LECO L-PAL 3 Autosampler |
| Injection |
Desorb for 2 min in GC inlet, split 20:1 |
| Gas Chromatograph |
LECO GC |
| Inlet |
250 °C |
| Carrier Gas |
He @ 1.4 mL/min |
| Column |
Rxi-5ms, 30 m x 0.25 mm i.d. x 0.25 μm (Restek) |
| Temperature Program |
40 °C (hold 2 min), ramp 10 °C/min to 250 °C (hold 2 min) |
| Transfer Line |
250 °C |
| Mass Spectrometer |
LECO Pegasus BTX |
| Ion Source Temperature |
250 °C |
| Mass Range |
35-500 m/z |
| Acquisition Rate |
10 spectra/s |
Results and Discussion
It is important to compare and characterize thyme samples from various origins because similarities and differences in their chemical compositions and related scents might impact production and end-product quality.
This, in turn, influences supply chain costs, consumer perception, and regulatory compliance.
The analysis of the four thyme samples using the BTX GC-TOFMS system allowed complete mass-range, non-target data to be gathered at full system sensitivity, revealing highly complex fragrance profiles (Figure 2).
This high-quality data enabled successful deconvolution, showing a large number of mass spectrally different characteristics, including co-eluting species, that could be confidently recognized.
In addition, automated statistical alignment of the data using ChromaTOF Sync for data processing allowed for quick, useful trends and patterns across the entire sample set to be easily visualized.
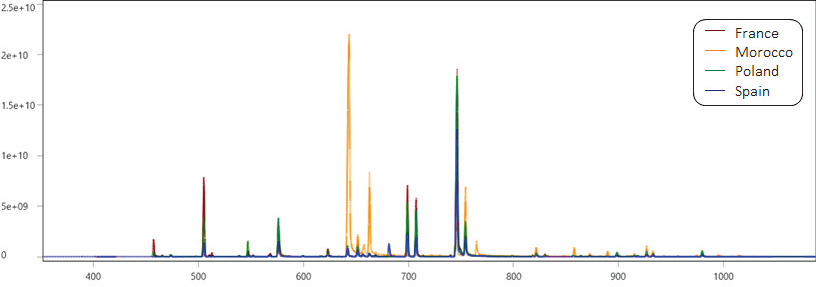
Figure 2. Overlaid full mass range chromatograms for the four thyme varieties. Image Credit: LECO Corporation
These untargeted analytes can often be identified by comparing observed mass spectral (MS) and retention index (RI) data to library databases.
For example, thymol and carvacrol (Figure 3) were identified using spectral matching to the NIST library database (similarity scores of 851 and 931 for thymol and carvacrol, respectively) and supported by matched RI values.
Because the spectral signatures of these two analytes are so similar, RI was very crucial in accurately assigning the identifications. Confident identifications of these two analytes offered useful information about the samples and the variation in their aromas.
Overall trends across the sample collection are visible in the superimposed chromatograms (Figure 3), suggesting differences in the relative levels of these analytes in thyme from various geographical regions.
For example, thymol was highest in thyme from France (maroon) and Poland (green), medium in Spain (blue), and lowest in Morocco (orange). The trends for carvacrol varied, with the highest levels seen in Moroccan thyme compared to other countries.
These trends may be significant because the analytes contain interesting olfactory notes that likely contribute to the scent profile of these samples. Thymol is defined as herbal, with notes of thyme, phenolic, medicinal, and camphor, whereas carvacrol is described as spicy, with spice, woody, camphor, and thymol.1
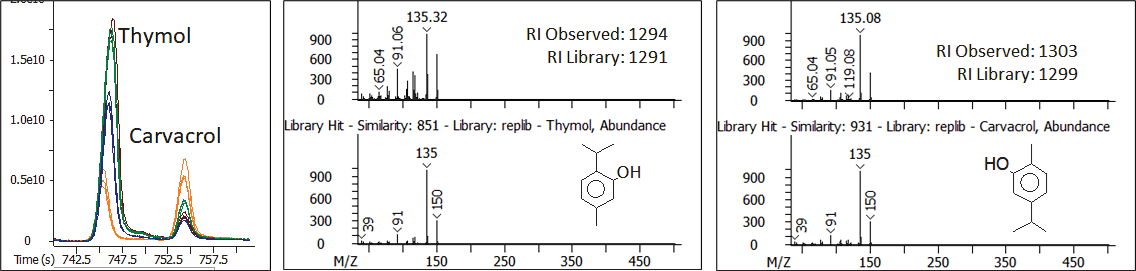
Figure 3. Thymol and carvacrol are identified with library searching of the full m/z data and supported with RI matching to library. Image Credit: LECO Corporation
In addition to providing full mass range and sensitivity data, TOFMS prevents mass spectrum skewing, which is common and problematic when utilizing scanning instruments.
This complete mass range, non-skewed data allows for more efficient use of deconvolution methods, which can often mathematically separate coeluting features.
For example, 2-pentyl furan and myrcene, which chromatographically overlap, were deconvoluted and statistically β-separated, yielding distinct spectra for each analyte (Figure 4).
Both analytes were confidently identified, with spectral matching to library databases (similarity scores of 835 and 801 for β--myrcene and 2-pentyl furan, β respectively) and RI support (observed RI of 992 and 993 compared to library values of 991 and 993 for β-myrcene and 2-β pentyl furan).
Plotting XICs for β-myrcene (m/z 93.07) and 2-pentyl furan (m/z 138.11) recognized individual chromatographic profiles and trends across the sample set. Thyme from Poland and France contain higher quantities of β-myrcene than samples from Spain and Morocco.
2-pentyl furan levels were equivalent in Poland, France, and Spain, but lower in Morocco. These trends could be significant because these analytes have distinct scent notes that likely contribute to the overall aroma profiles of the thyme samples.
β-myrcene possesses spicy scent characteristics that include peppery, terpene, spicy, balsam, and plastic descriptors. 2-pentyl furan has fruity, green, earthy, beany, vegetable, and metallic flavors.1
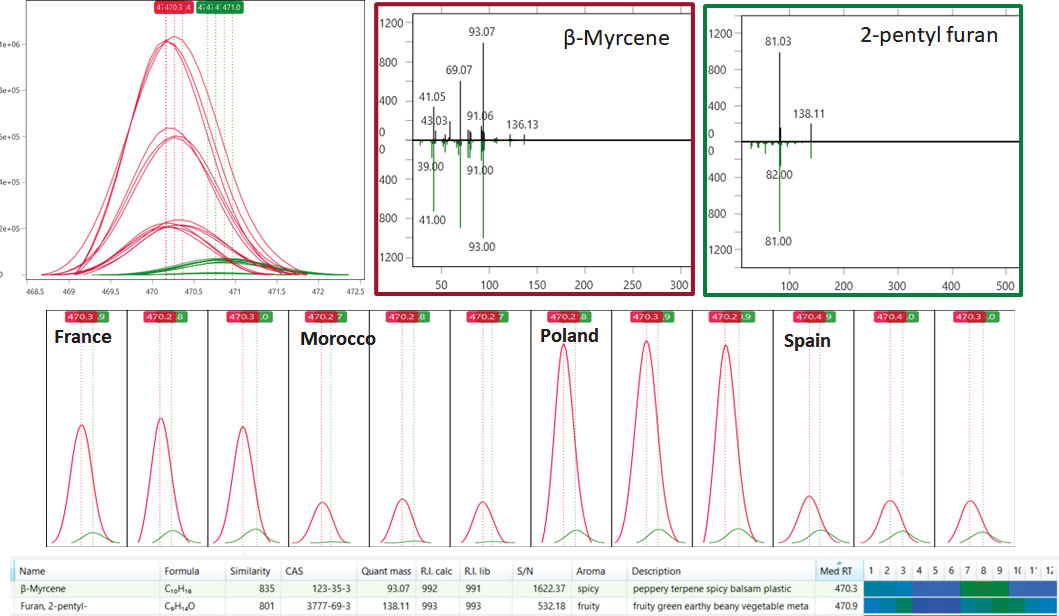
Figure 4. Beta-myrcene and 2-pentyl furan chromatographically overlap and are mathematically separated with deconvolution. Image Credit: LECO Corporation
The BTX TOFMS system's highly sensitive mass spectral detection allowed for outstanding non-target analyte detection and the discovery of a large number of trace-level species.
Many low-level characteristics are buried in the background and difficult to see in the TIC, hence, automated peak detection and deconvolution were useful for extracting spectral information in these cases.
For example, the TIC did not show an analyte classified as 2-hexanone (Figure 5), but deconvolution revealed spectral information that matched the library with a similarity score of 859.
The identification of 2-hexanone was further corroborated by an observed RI value of 795 versus 790 in the library. Even though the feature was obscured in the TIC, automated ion extraction of the unique XIC (m/z 100.09) revealed the peak profile and quantitative trends.
This analyte was found at higher quantities in thyme from France and Poland, but at lower levels in thyme from Morocco and Spain. These changes may be significant given the analyte's fruity aroma characteristics.1
In addition, the odor strength is listed as high1, implying that even low levels of this compound may influence the overall aroma characteristics and contribute to the differences between the samples.
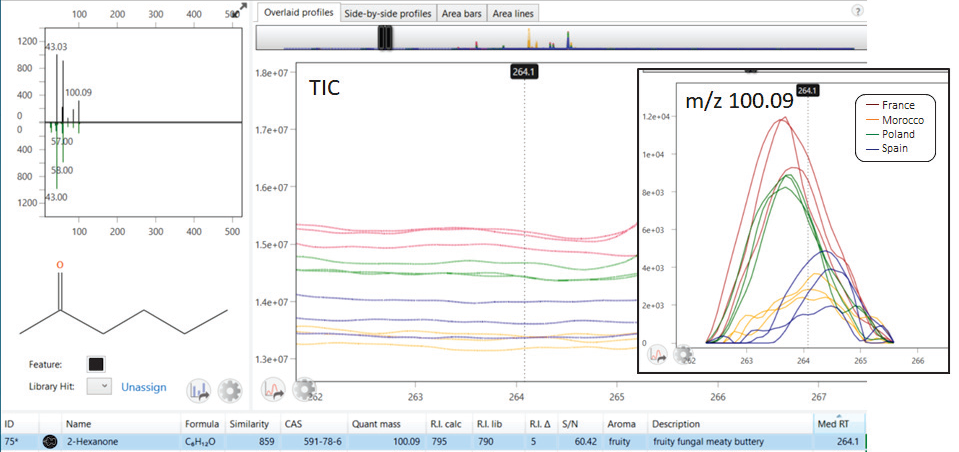
Figure 5. Sensitive detection and automated peak finding reveal low-level analytes that may not be visible in the TIC. Image Credit: LECO Corporation
Aligning and statistically comparing the numerous features within the rich, non-target data from the BTX TOFMS Pegasus system can be a time-consuming task in a multi-sample and replicate analysis. The use of ChromaTOF Sync significantly improved the speed and quality of this process.
For example, ChromaTOF Sync displays multi-replicate and sample results for thymol and carvacrol in an informative manner (Figure 6). The peak table includes peak areas for all 12 samples, making it easy to see trends across the dataset.
Peak area trends are visualized as overlaid chromatographic profiles, side-by-side chromatographic profiles, bar charts (line charts are also available), and color deviations in the peak table's heat map.
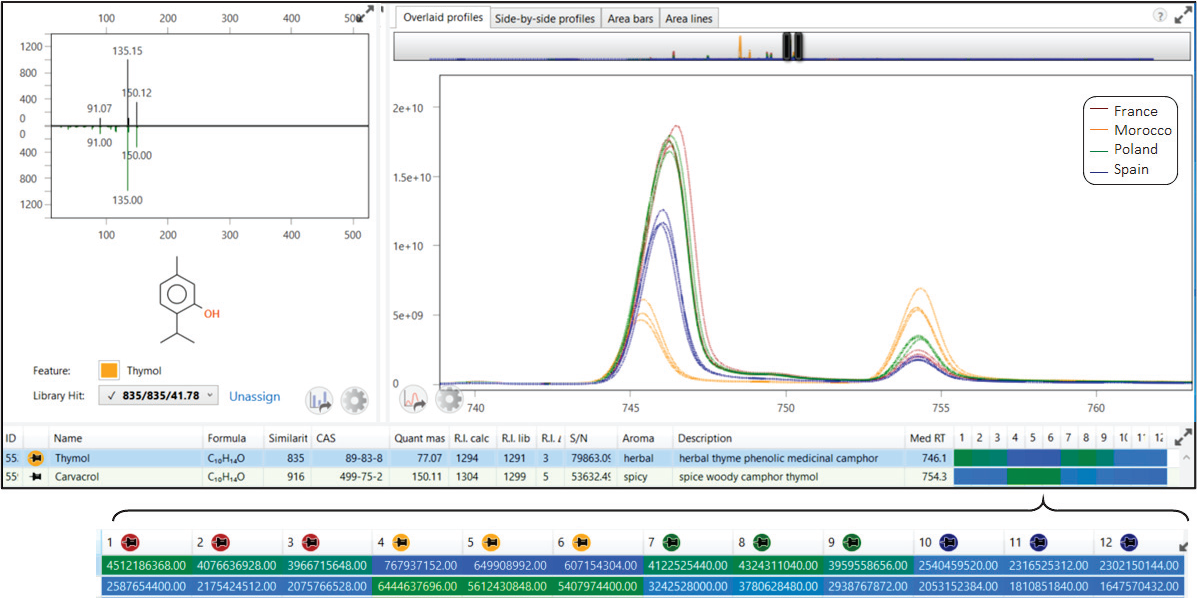
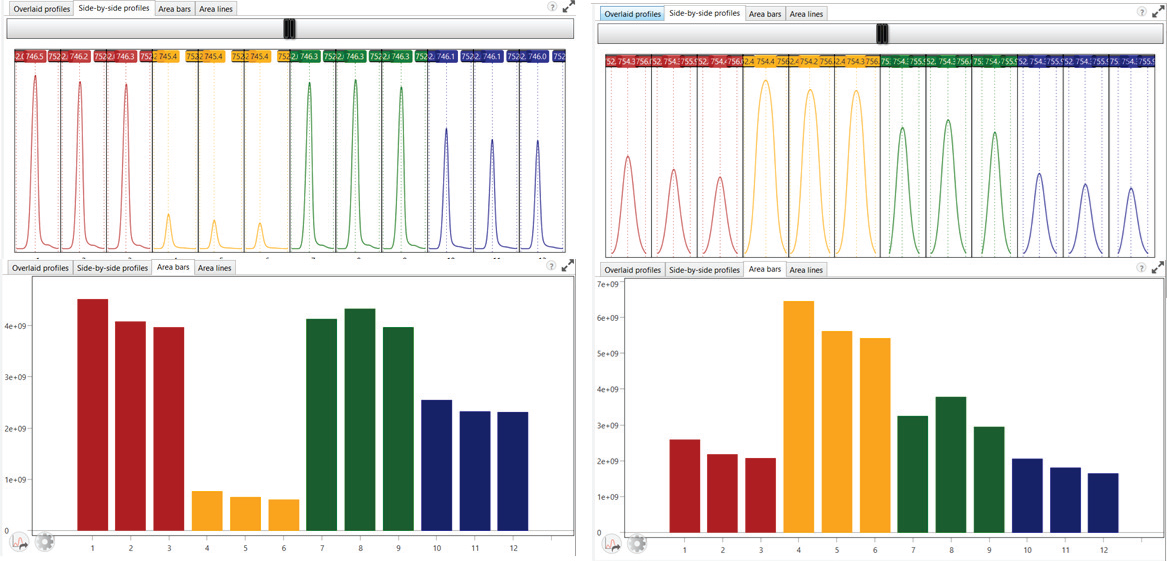
Figure 6. Peak information is compiled for the entire sample set with ChromaTOF Sync. Thymol (left) and carvacrol (right) are shown. Image Credit: LECO Corporation
Principal Component Analysis (PCA) was also used with the assembled peak data to find overall trends between the samples. The scores plot (Figure 7, left) shows each sample duplicate as a data point.
The samples closest to each other are more similar, while those further apart are more distinct. It allows for a simple visualization of the data; thyme from Morocco and Spain are very different, whereas thyme from Poland and France are more similar.
The corresponding loadings plot (Figure 7, right) shows how the analytes (variables) contribute to the overall patterns, which can then be studied further. For example, Figure 8 shows the degree of differentiation for four exemplary analytes (designated A, B, C, and D on the loadings plot).
This approach allows for the easy detection of analyte features that contribute to significant sample variations, as well as the examination of probable identifications utilizing mass spectral and RI matching libraries.
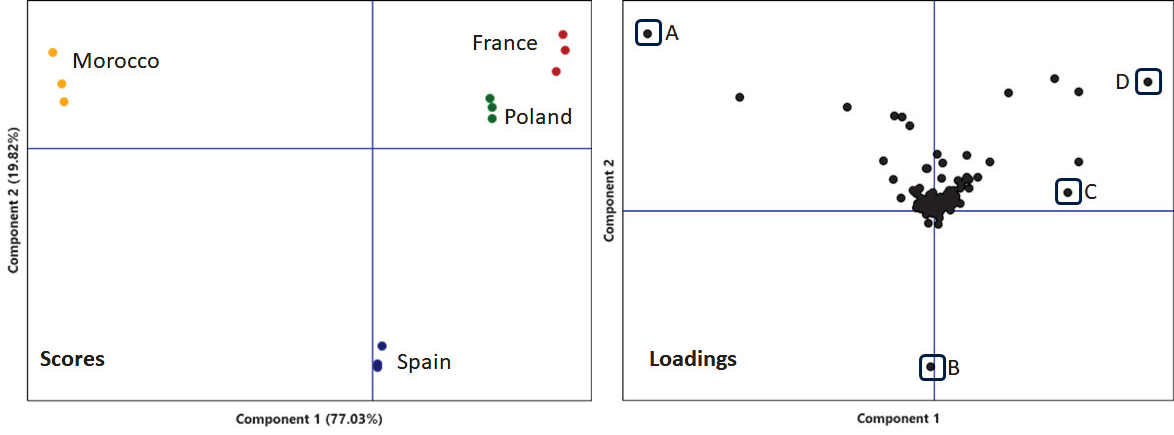
Figure 7. PCA scores and loadings. Image Credit: LECO Corporation
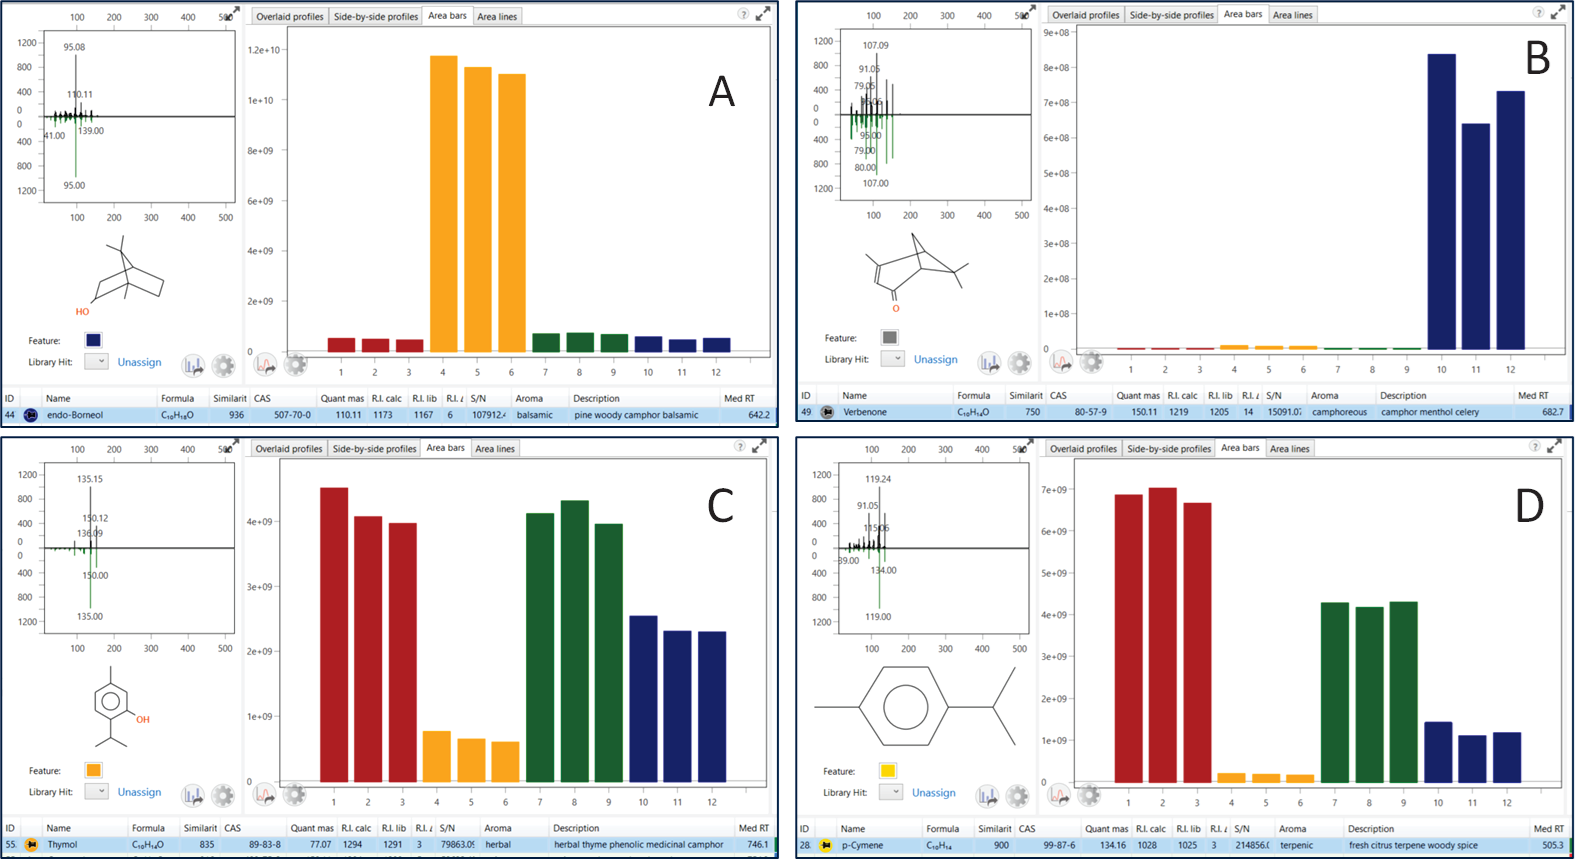
Figure 8. Representative analytes with distinct trends. Image Credit: LECO Corporation
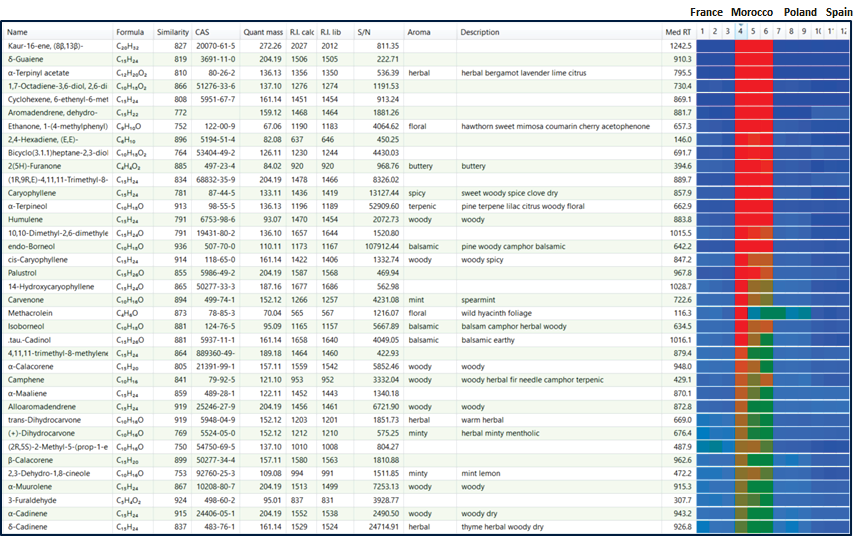
The heatmap feature in the peak table also allowed the many analytes found in the thyme samples to be viewed together, enabling highly efficient data interpretation and focus.
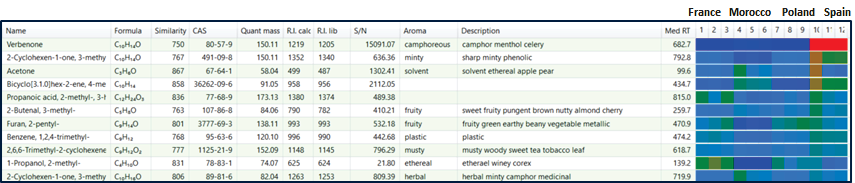
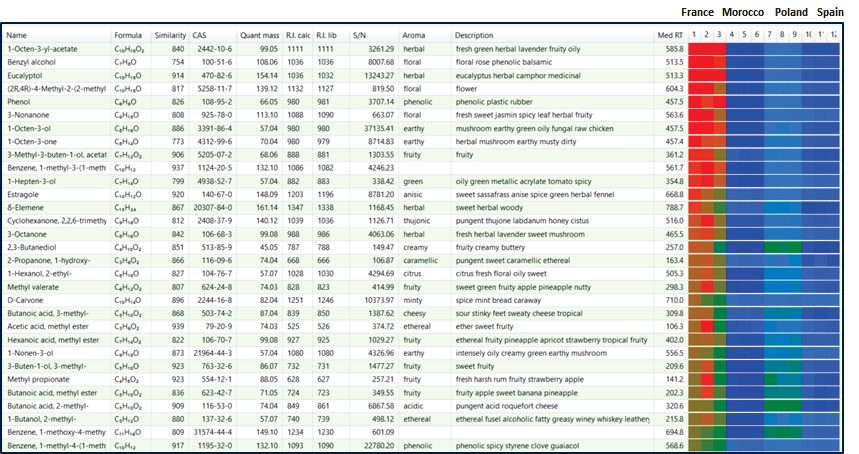
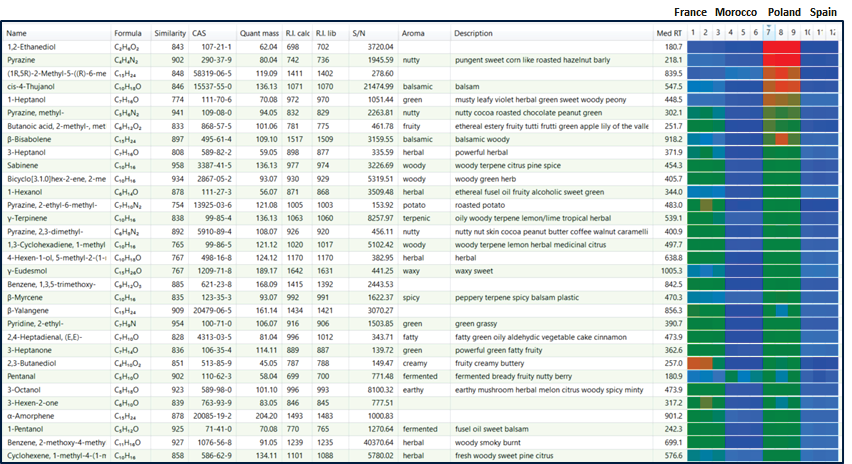
The peak tables can be sorted by heatmap for each country, so analytes that were observed as elevated in the thyme from Morocco (Table 2), for example, are shown as “hotter” (red) in the top section of the table. Other representative analytes, sorted by heat map for France, Poland, and Spain, are also provided (Appendix A).
This feature allows fast navigation through the peak table and allows focus to be drawn to relevant details, which differentiates the thyme sample. For example, the thyme from Morocco tended to have higher quantities of terpenes and terpenoids and several of the analytes had woody fragrance descriptors.
The thyme from Spain exhibited fewer analytes that were particularly distinguishable, but those that were tended to have consistent scent descriptions with camphor or minty characteristics. Many of the analytes that were raised in the thyme from Poland were also elevated in the thyme from France.
This was consistent with Poland and France's close proximity on the PCA scores plot. This category had more nitrogen-containing chemicals, some of which were described as having a nutty fragrance.
The functional group diversity in the analytes identified at higher levels was greater in French thyme, with more esters, carboxylic acids, and alcohols present.
Table 2. Representative analytes displayed in a section of the peak table, sorted by heat map for Morocco. Source: LECO Corporation
Conclusion
In this study, the Pegasus BTX GC-TOFMS equipment and ChromaTOF Sync were used to analyze and compare dried thyme samples from four countries: France, Morocco, Poland, and Spain.
Rich, non-target data with complete mass range capture and increased sensitivity were gathered, allowing rapid deconvolution and excellent analyte detection coverage throughout these complex samples.
ChromaTOF Sync rapidly aligned and compiled analyte information throughout the sample set, allowing for easier comparison and interpretation.
Many distinct analytes with intriguing aroma notes were discovered in each of the thyme samples, and alignment allowed links to be drawn between these distinguishing compounds and the origins of the four thyme kinds.
Much of the sample preparation was automated using the LPAL-3 autosampler and ChromaTOF software, which also controls the GC and MS operations. The Pegasus BTX features a StayClean™ Ion Source, which removes the need for source cleaning, making it ideal for routinely analyzing many samples.
This efficient, comprehensive workflow solution exhibits the capacity to swiftly gather critical information, which can assist consumer goods makers in developing better products, understanding the competition, and responding quickly to quality, supply, or manufacturing challenges.
Acknowledgments
The authors would like to thank McCormick & Company for donating the thyme samples.
References
- Good Scents database, http://www.thegoodscentscompany.com
[Appendix A]
Source: LECO Corporation

This information has been sourced, reviewed and adapted from materials provided by LECO Corporation.
For more information on this source, please visit LECO Corporation.