Reviewed by Olivia FrostApr 7 2025
Branching is a critical structural parameter of many synthetic and natural polymers, drastically affecting their properties. The properties impacted by branching comprise numerous mechanical characteristics, thermodynamic properties, viscosity and rheological behavior of polymer solutions and melts, and the capacity to crystallize or dissolve.

Image Credit: Corona Borealis Studio/Shutterstock.com
Quantitative data regarding branching topology is crucial for developing novel polymer-based materials with enhanced characteristics and understanding polymerization processes.
Characterizing branching using size exclusion chromatography (SEC) or asymmetric flow field flow fractionation (AF4) would be impossible without a multi-angle light scattering (MALS) detector. The significance of branching is evident from various scientific papers on branching.
Wyatt Technology’s Comprehensive Solution Gets Users Started Faster
For over 30 years, Wyatt instruments have played a pivotal role in polymer branching studies, as demonstrated by the Wyatt Bibliography, which features over 200 citations with the keywords “polymer branching.” Wyatt solutions enable the analysis of both synthetic and natural polymers, such as hyaluronic acid and natural rubber.
Wyatt Technology offers a complete package of hardware, software, and support for SEC-MALS analysis:
- DAWN™: The world’s most advanced MALS detector
- ASTRA™ software: Provides powerful analysis tools, including a built-in polymer branching analysis module
- Excellent support and resources: Includes a library of technical notes with easy-to-follow analysis steps and access to expert staff
 Download the application note to explore the theory, data, and analysis in detail.
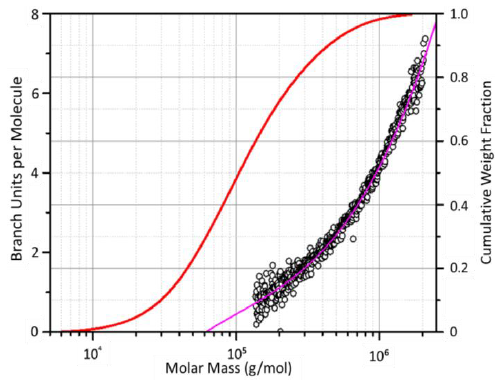
Figure 1. Top: Conformation plots of linear (blue) and branched (red) polystyrene. Center: The corresponding plot of branching ratio ver-sus molar mass. Bottom: The number of branch units per molecule plotted versus molar mass. The plot of branch units per molecule versus molar mass is overlaid with the cumulative molar mass distri-bution (red), and the 3rd order fit to experimental data points (ma-genta). The slopes of the conformation plots of linear and branched polymer are 0.59 and 0.48, respectively. Image Credit: Waters | Wyatt Technology

This information has been sourced, reviewed and adapted from materials provided by Waters | Wyatt Technology.
For more information on this source, please visit Waters | Wyatt Technology.