Capillary pressure is an important parameter for the oil exploration and production industry, and is commonly measured in core analysis laboratories. However, conventional techniques such as centrifugation, porous plate, and mercury injection are difficult, time consuming and expensive.
GIT-CAP Capillary Pressure Measurement Method
Dr. Derrick Green of Green Imaging Technologies demonstrated this method of capillary pressure measurement at a meeting of the Society of Core Analysts in 2007. The method is known as GIT-CAPTM, and centrifuges core plug samples after which it directly measures the water saturation distribution using a single-dimensional NMR profile which is a simplified version of Magnetic Resonance Imaging, or MRI. This method is as precise as porous plate and is many times quicker than conventional centrifuge capillary pressure measurements.
The patented GIT-CAP capillary pressure measurement method employs capillary pressure theory integrated with NMR- determined saturation profiles, enabling the accurate development of capillary pressure curves. In this method, first the core plug is completely saturated with brine, and is then centrifuged to form a fluid distribution in the plug which in turn relies on capillary pressure. Quantification of the fluid distribution is done using NMR.
The capillary pressure at each point along the plug at hydrodynamic equilibrium is obtained from Equation (1).

In the above equation, Pc(r) is the capillary pressure at any given radial position, Δρ is the difference in density of the two fluids, ω is the rotational speed and r2 is the distance to the outlet face of the plug.
According to this equation the outlet boundary condition of 100% water saturation or zero capillary pressure is maintained. This means that in any centrifuged plug, there will be an equal distribution of saturations of 100% at the outlet and at the inlet, which is governed by the rotational speed. Saturation profiles obtained after centrifugation at different speeds can be plotted on the same curve thus increasing the range and resolution of the capillary pressure curve.
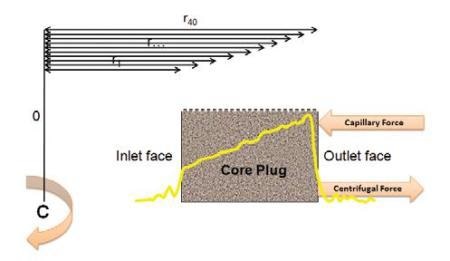
Figure 1. GIT-CAP capillary pressure technique measuring 30 - 40 data points.
This technique worked well on a wide range of samples. Precise saturation profiles are ensured by using advanced SPRITE- based MRI techniques.
Hardware
The benefits of the GIT-CAP measurement are boosted by the GeoSpec2 hardware, which has considerably decreased acquisition times, as well as an improved signal to noise ratio. Decreased acquisition times make the GIT-CAP measurement even quicker while the improved signal to noise ratio and short echo times make sure the information collected is more precise. Measurements are monitored by the GIT-CAP software and can be performed easily by core laboratory technicians. An in-depth knowledge of NMR techniques is not required.
Results and Discussion
Characteristic results are displayed in the following figures for two sandstone samples. The associated saturation profiles are included to show the amount of fluid movement within the samples at each centrifuge speed.
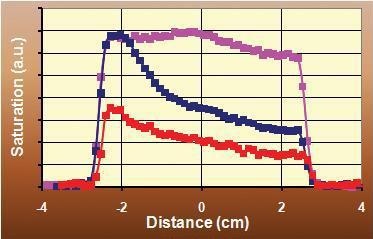
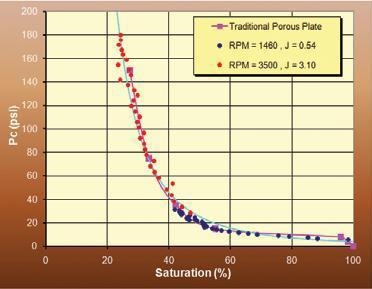
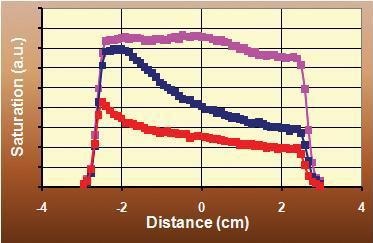
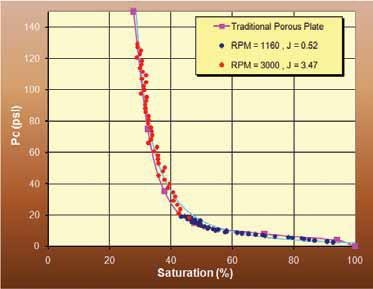
In order to determine the full capillary pressure curve, only two different centrifuge speeds are required. The results are obtained quickly as compared to conventional techniques and the measurement is accurate and direct.
Advantages of the GIT-CAP Technique
The following table is a comparison between the GIT-CAP measurement technique to traditional capillary pressure measurement methods.
| |
GIT-CAP Advantages |
| Mercury Injection |
- Uses representative fluids
- Non-destructive
- Direct measurement
- Simpler sample handling procedures
|
| Traditional Centrifuge |
- Speed (GIT-CAP takes days, centrifuge takes weeks)
- Accuracy/more data (GIT-CAP provides 30-40 data points per centrifuge speed)
- Simpler centrifuge set-up (no costly upgrades required)
|
| Porous Plate |
- Speed (GIT-CAP takes days, porous plate takes weeks or months)
- More data points
|
The GIT-CAP NMR measurement has an inherent time and accuracy advantage that will enable a laboratory increase the sample throughput by at least three times for every centrifuge.
The following table illustrates how to maximize sample throughput using this measurement method.
| |
1 Centrifuge |
2 Centrifuges |
| |
Traditional |
GIT-CAP |
Traditional |
GIT-CAP |
| Samples per centrifuge |
4
|
4
|
4
|
4
|
| Test duration in days (including sample preparation) |
10
|
3
|
10
|
3
|
| Days per year |
250
|
250
|
250
|
250
|
| Pc Tests/year |
100
|
330
|
200
|
660
|
Conclusions
Capillary pressure measurements using the GIT-CAP method are significantly quicker than those made by conventional techniques, especially for low permeability samples with longer equilibrium times. They also provide significantly more data points, enabling more accurate prediction of additional parameters such as pore throat distributions, relative permeability and wettability.

This information has been sourced, reviewed and adapted from materials provided by Oxford Instruments Magnetic Resonance.
For more information on this source, please visit Oxford Instruments Magnetic Resonance.