The mIRage® IR microscope is a groundbreaking new microscopy system that offers sub-micron IR spectroscopy and imaging in a wide range of applications.
mIRage® bridges the gap between conventional IR microspectroscopy and nanoscale IR spectroscopy by breaking the diffraction limit of traditional IR spectroscopy using a patented approach based on Optical Photothermal IR (O-PTIR) spectroscopy.
- Non-contact reflection-based IR measurement without IR spectral artifacts and with spectral quality similar to that of FTIR transmission
- Spectroscopy is quick, simple to use, and requires little to no sample preparation.
- Overcomes the restrictions of Raman spectroscopy.
Download the Brochure for More Information
Applications
Life Science – Cells
Co-Located Fluorescence + Sub-Micron IR of Cells
Neuroglioma cells were labeled with G3BP1 for protein stress granules, DAPI for the nucleus, and BODIPY for lipids.
The image on the left displays a widefield epi-fluorescence RBG overlay. Red highlights protein stress granules, blue highlights the nucleus, and green highlights lipids. Square markers show O-PTIR spectral collection locations.
The brightfield image is displayed in the right image. Square markers show O-PTIR spectral collection locations.
The O-PTIR spectra in the bottom figure were obtained in seconds from the marker locations depicted in the left and center panes. Clear spectral variations correspond to the intended subcellular properties.
The modest change in the Amide I band of the protein stress granule is especially noteworthy, indicating that the protein secondary structure is likely different from that of the other places.
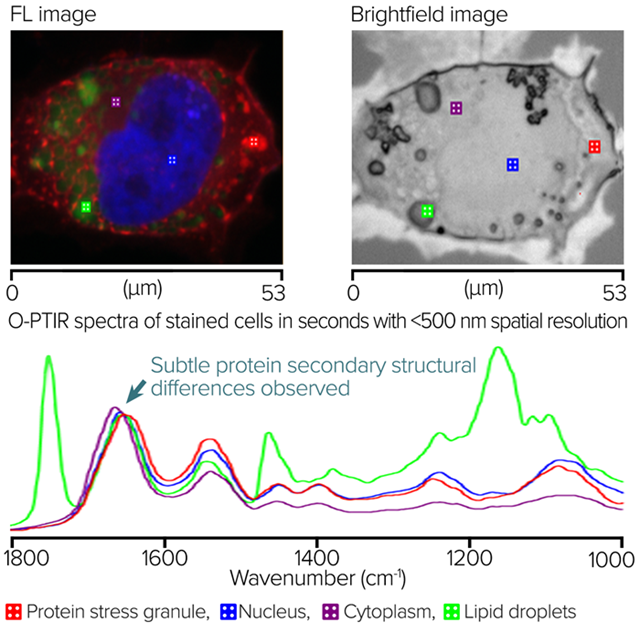
Image Credit: Photothermal Spectroscopy Corp
O-PTIR Measurement of Cell in Water (H2O) with Water Dipping Objective
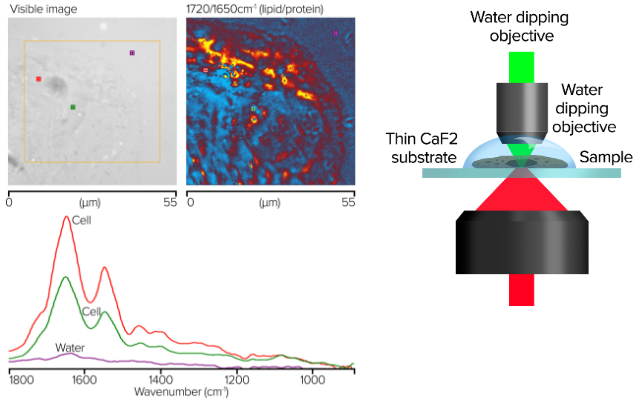
Image Credit: Photothermal Spectroscopy Corp
- Probe beam detected in single frequency mode
- No water background compensation
- Spectra show little to no water absorbances
- Cheek cells in water on thin glass (~300 µm CaF2)
- Water dipping objective, 40×, 1.0 NA
- Spectra collected in seconds
- Images in minutes
- Images collected in single frequency mode with 50 nm step size
O-PTIR of Fixed Cell with Oil Immersion Objective
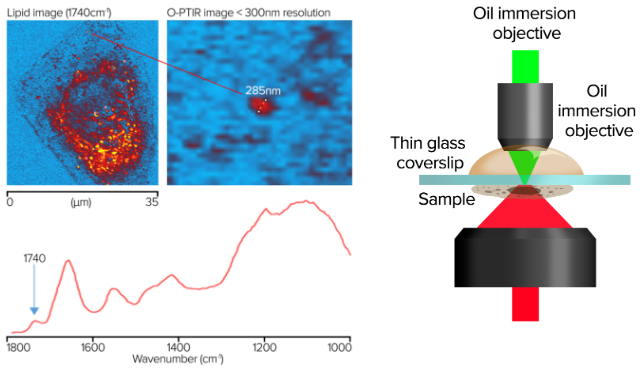
Image Credit: Photothermal Spectroscopy Corp
- Spatial resolution of ~285 nm
- Images collected in minutes in single frequency mode with 50 nm step size
- Spectra collected in seconds
- Cheek cells on glass coverslip (170 nm)
- Oil immersion objective, 100×, NA 1.30
Submicron Amyloid Aggregate Imaging in Neurons
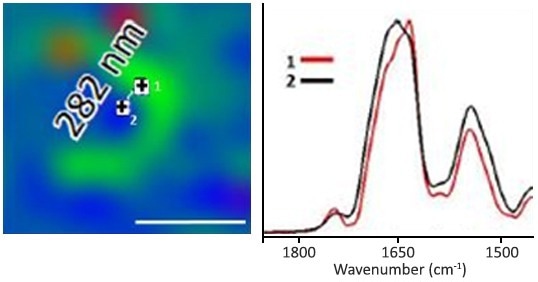
Image Credit: Oxana Klementieva et al., “Super-resolution infrared imaging of polymorphic amyloid aggregates directly in neurons”, Adv Sci, Adv. Sci. 2020, 1903004. https://doi.org/10.1002/advs.201903004
Left: O-PTIR, single frequency ratio image of 1630/1656 cm-1. Shows the distribution of beta protein structures with a separation of 282 nm. Right: O-PTIR spectra from the IR image (left), with spectra on (#1) and off (#2) the beta protein structure. Spectral discrepancies demonstrate changes in the amide I band, characteristic of beta-sheet structured proteins, even though these two locations are just 282 nm apart.
Targeted Imaging Mode (Chemically Specific Imaging) Intra-Cellular Imaging, Off Glass Slide, At 100 nm Step Sizes
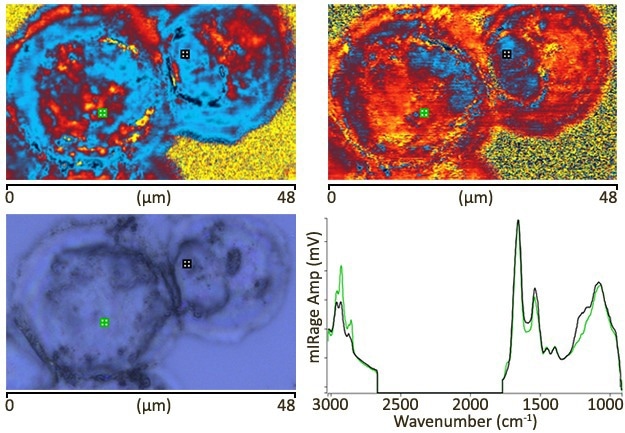
Image Credit: Sample courtesy of Prof Jose Sule-Suso, Keele University, UK.
Both IR images at the top were acquired with a 100 nm pixel size, taking approximately five minutes per image. The spectra from markers are displayed at the bottom right corner. They are single scans with a measurement period of approximately one second and no processing. Data were acquired utilizing the new “Dual range (C-H/FP)” QCL, which has spectral range coverage of 3000-2700 and 1800-950 cm-1.
Life Science: Tissue
Using Fluorescence to Localize O-PTIR Measurements
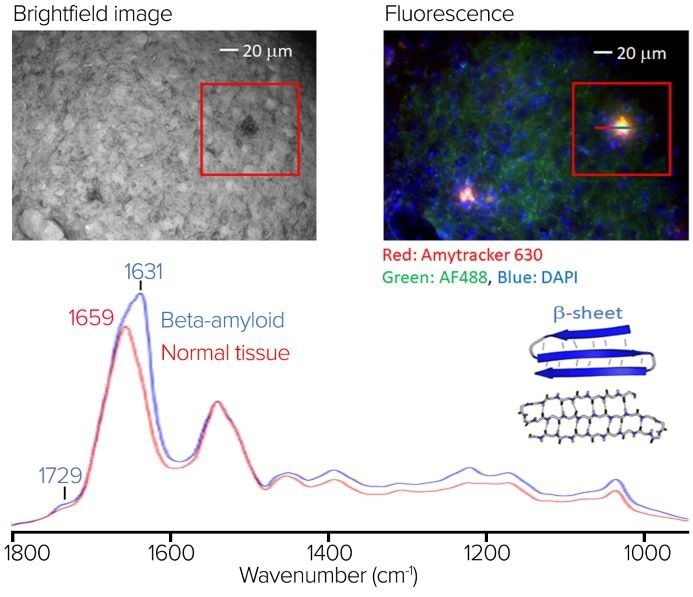
(top left) The brightfield image of the stained sample. (top right) The RBG composite fluorescence image. (bottom) An averaged O-PTIR spectra from the line profile is shown in the RBG composite fluorescence image. Image Credit: Photothermal Spectroscopy Corp
An Alzheimer’s disease mouse model brain tissue slice was stained with Amytracker 630 to identify amyloid aggregates, AF488 to highlight proteins, and DAPI for the nucleus.
The stained sample is depicted in the image to the right as a brightfield image, top left. The RBG composite fluorescence image is shown in the upper right corner, with amyloid aggregation locations highlighted in red/orange. Notice how some of the amyloid aggregates indicated in the fluorescence image are difficult to discern in the brightfield image.
At the bottom is an averaged O-PTIR spectra from the line profile seen in the fluorescence picture, with spectra averaged on (blue) and off (red) the aggregate. The aggregate’s average spectrum reveals substantial spectral variances in the amide I band, including a large spectral signature at 1631 cm-1, indicative of protein beta-sheet structures.
This demonstrates the usefulness of combining submicrometer O-PTIR spectroscopy, which can then provide the molecular compositional information in this case because it is particularly sensitive to protein secondary structure, a characteristic strength of IR spectroscopy, with fluorescence imaging to highlight regions of amyloid aggregation, some of which cannot be readily seen in brightfield microscopy.
IR Polarized O-PTIR To Study Collagen Orientation in Individual Fibrils and Tendon
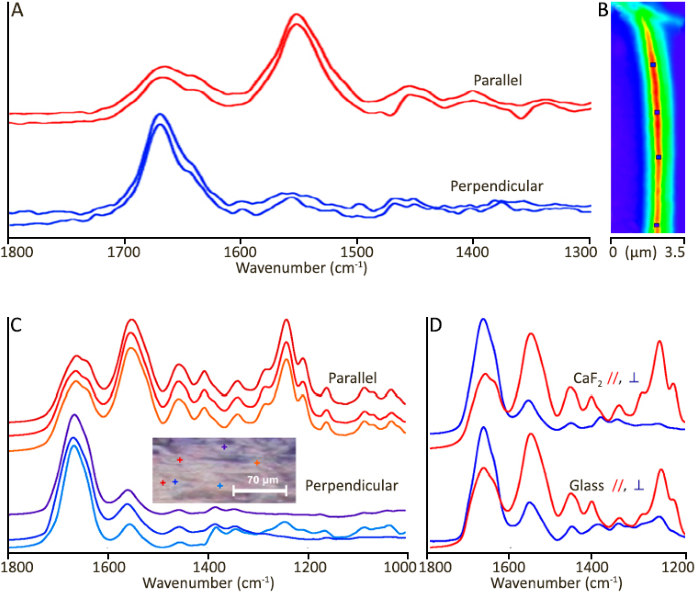
Image Credit: Gorker Bakir et al., “Orientation Matters: Polarization Dependent IR Spectroscopy of Collagen from Intact Tendon Down to the Single Fibril Level”, Molecules 2020, 25, 4295. https://www.mdpi.com/1420-3049/25/18/4295
A: O-PTIR spectra acquired from control tendon fibrils on the CaF2 window. B: The single-frequency image on the right was acquired at 1655 cm-1 in perpendicular orientation. Markers indicate the locations from which spectra were obtained. Scale bar equals 1 µm.
(B) Individual spectra were obtained from two orientations of a portion placed on a CaF2 window in relation to the linearly polarized QCL. The included visual picture depicts six sites within the FTIR FPA imaged region (scale bar = 70 μm). C and D: Optical photothermal IR (O-PTIR) spectra from intact tendon at ~500 nm measurement locations.
Colored markers (+) in the image represent spectral hues. (C) A comparison of spectra from CaF2 (top) and glass (bottom) substrates in parallel and perpendicular orientations to linearly polarized QCL.
Breast Tissue Calcification – Demonstration of <1-micron Spatial Resolution with O-PTIR
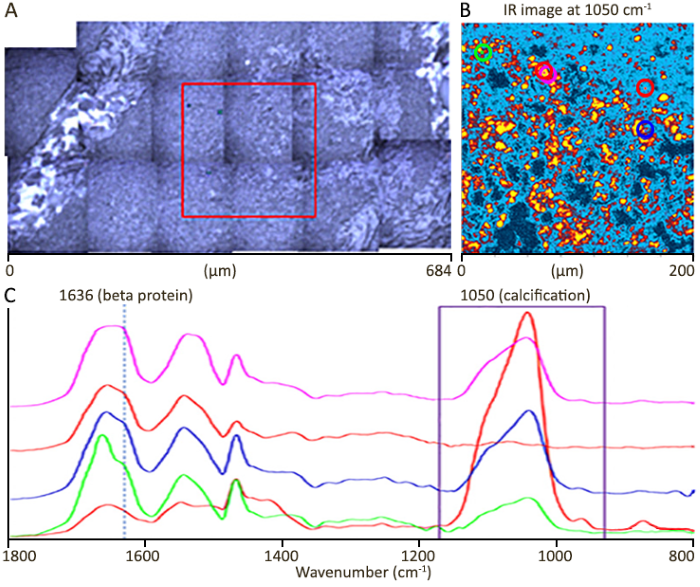
Image Credit: Sample courtesy of Prof Nick Stone, Exeter University, UK.
A: optical image (mosaic). The red box represents the IR image measuring region. B: A single frequency image at 1050 cm-1 to show calcification locations. C: O-PTIR spectra obtained from colored circle markers in IR image (B).
IR image area 200×200 microns at 500 nm step size. Image time, ~10 mins.
Calcification IR image at 1050 cm-1 resolves calcifications averaging only a few microns in size, with many measuring less than 1 micron. At 1050 cm-1, standard FTIR has a spatial resolution of ~12 microns, substantially bigger than the real features. This is why such small and localized calcifications were not previously observed.
Download the Brochure for More Information
Life Science: Bacteria
Single Bacterial Cell O-PTIR Microscopy with Deuterium Labelled E. Coli
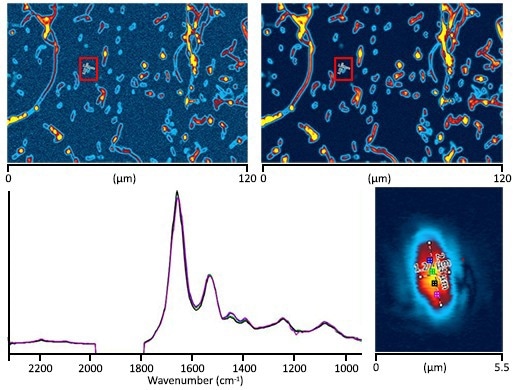
Image Credit: Photothermal Spectroscopy Corp
A: O-PTIR image at 1655 cm-1 (protein) with 200 nm step size. B: O-PTIR image at 2195 cm-1 (C-D stretch) with 200 nm step size. Both images took three minutes to obtain. C: A single E. Coli cell (2.6×1.3 microns) imaged at 1655 cm-1 with 50 nm steps. Image time: ~1 minute. D: Four submicron (~500 nm spot) O-PTIR spectra were obtained from a single bacterial cell image (Upper Right) with associated colors.
Spectra are standardized to 1655 cm-1. Intracellular changes can be seen in the location and form of the Amide I band, which indicates intracellular chemical (protein secondary structure) differences. Each spectrum has 10 averages (about 15 seconds). C-D absorbances can be seen at around 2195 cm-1 and 2100 cm-1.
Single Bacterial Cell Simultaneous Submicron IR+Raman Microscopy
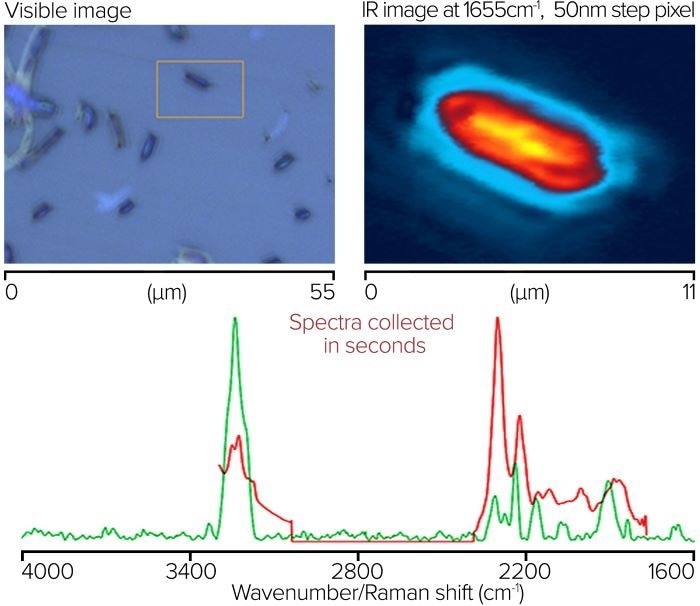
Image Credit: Photothermal Spectroscopy Corp
A visible image of bacterial cells. The orange box indicates the location of IR imaging. B: O-PTIR infrared picture at 1655 cm-1, 50 nm step size. Collection time: ~1 minute. C: Submicron IR and Raman spectra were acquired from the indicated location on a single bacterial cell. Spectra are adjusted to the highest intensity band and accumulate for approximately 20 seconds.
O-PTIR spectra are acquired using a Dual Range (C-H/FP) QCL covering 3000-2700 and 1800-950 cm-1 in a single device. The O-PTIR spectra are raw (no processing). Raman spectra are baseline corrected.
The OPTIR (~500 nm spot) has a signal-to-noise ratio of around 4000:1 (RMS, considering amide band intensity as the peak and baseline noise at the amide I location measured on a CaF2 blank) with ~20 sec accumulations.
Microplastics
Sub-Micron IR Shape and Size Independent Spectra
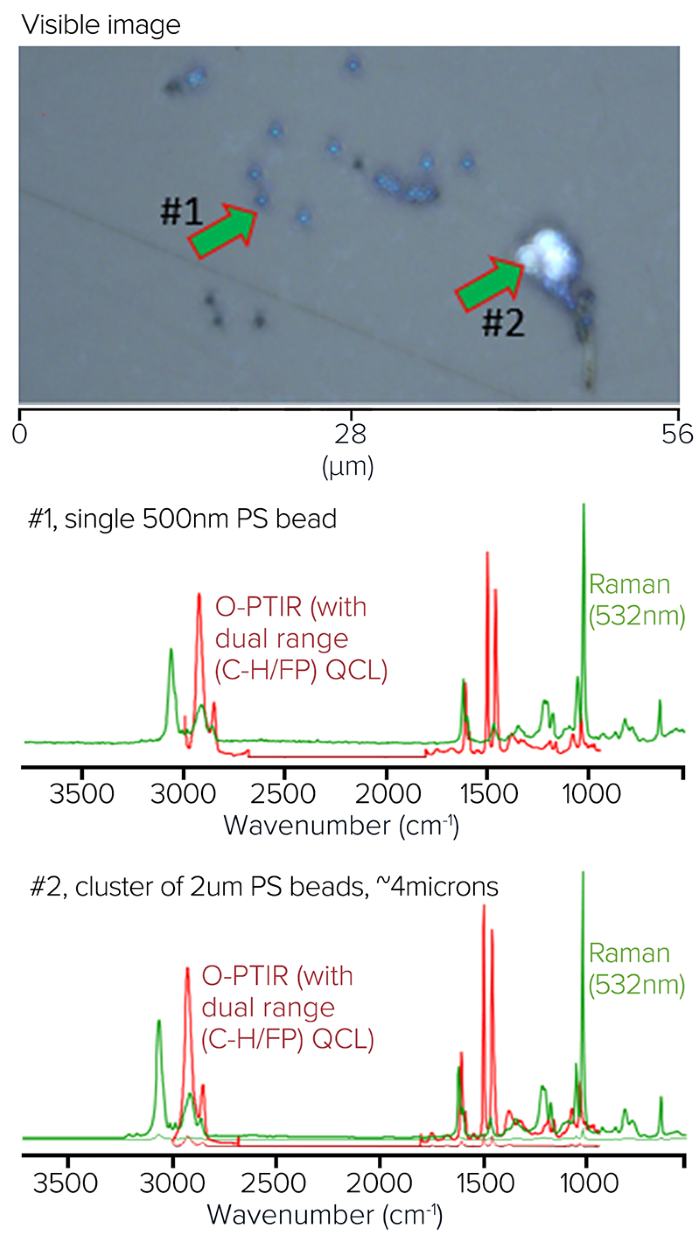
Image Credit: Photothermal Spectroscopy Corp
Photothermal created a mixed model sample with Polystyrene (PS) beads (900 nm, 2 μm, 4.5 μm, and 10 μm) and Poly(methyl methacrylate) (PMMA) to demonstrate O-PTIR's ability to measure different particle shapes and sizes with artifact-free data collection in the presence of highly scattering salt crystals.
In addition to being too small to measure with an FT-IR/QCL system, the range of particle sizes and the proximity of salt crystals would produce dispersive scatter artifacts that could drastically change the spectra and complicate accurate identification.
The image shows these mixed polymer bead samples suspended in salt water and deposited on a CaF2 substrate. The polymer beads are interspersed with salt crystals, further demonstrating the relative immunity to scattering artifacts.
Notably, all spectra appear to be entirely consistent with the type of polymer they represent, even if they were obtained from beads of various sizes (i.e., dispersive scatter artifacts are absent). This guarantees accurate identification, independent of particle size and shape.
Fluorescence Imaging + O-PTIR of Microplastics
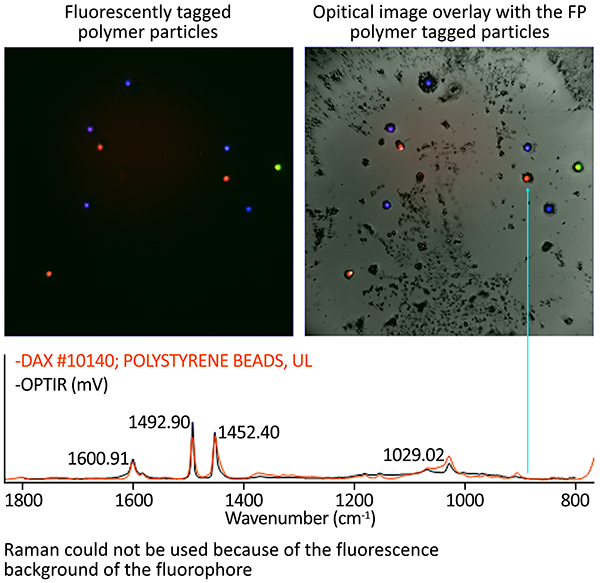
Image Credit: Photothermal Spectroscopy Corp
Polymeric bead fluorescence tagging can significantly expedite analysis by separating the polymer particles from other particles for O-PTIR measurement.
Sub-Micron IR+Raman Microplastics
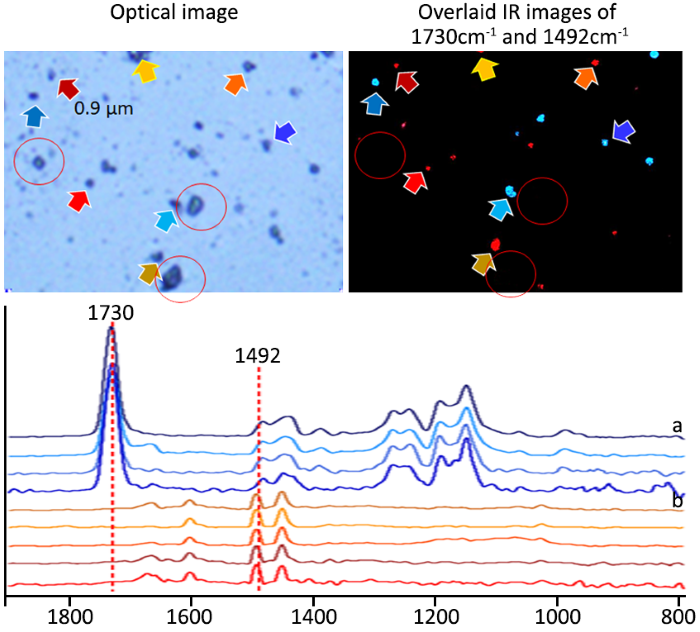
Image Credit: Photothermal Spectroscopy Corp
Using high-resolution IR images in critical absorption bands, mIRage locates PS (0.9 µm, 2.0 µm, 4.5 µm, and 10 µm) and PMMA beads (3.0 µm) in salt crystal mixtures. Even in the presence of salt crystals at hotspots, distortion-free spectra can easily be compared to an IR database and validate the identity of the microplastics.
Crucially, when measured in reflection mode, there are no dispersive scatter artifacts, and spectra are consistent regardless of particle size or shape, in contrast to conventional FTIR/QCL systems.
Polymers
Polymer Laminates Analysis with O-PTIR
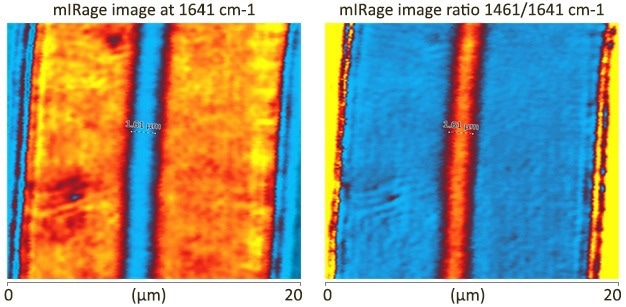
Image Credit: Photothermal Spectroscopy Corp
- Image collected at 100 nm steps (~3 mins per image)
- Key peaks at 1642 cm-1 (Nylon) and 1142 cm-1 are used for single-frequency imaging
- Central EVOH layer of 1.6 microns clearly visible
O-PTIR – Polymer (PLA-ACM) Phase Dispersions
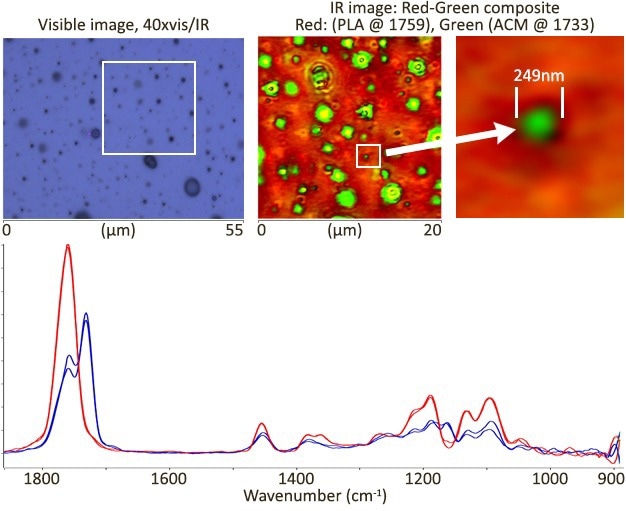
Image Credit: Sample courtesy of Dr Rudiger Berger, Max Planck Inst Polymer Research, Mainz, Germany
High spatial resolution images were obtained in minutes, while high-quality spectra were obtained in seconds. The image displays the image resolution of an ACM inclusion as tiny as 249 nm.
Noticeable spectral differences were attributed to PLA and ACM's expected chemical domains.
Imaging and Spectroscopy of Bioplastic Laminates
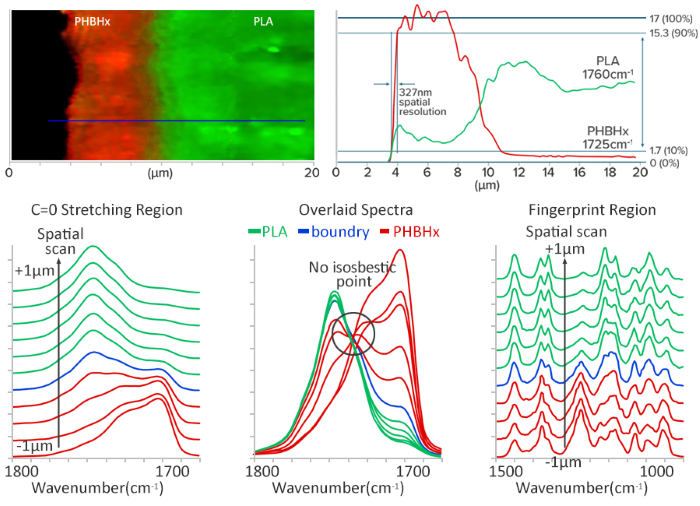
Composite (red/green) single-frequency images. Image Credit: Photothermal Spectroscopy Corp
- Bioplastic laminate using O-PTIR scanning
- A linear sampling scan spanning 8.0 µm was performed at 100 nm intervals (plotted every 200 nm and across 2 µm for clarity) over the bioplastic laminate's border, transitioning from the pure PHBHx layer to pure PLA
- Gradual spectral variations over a considerably larger region than the optical resolution indicate a heterogeneous distribution of PLA and PHBHx with no abrupt boundaries.
- No distinct isosbestic point indicates that the system is not a simple binary combination.
- PLA and PHBHx contributions overlap and blend in the fingerprint area
Download the Brochure for More Information
Spatial Resolution Breakthrough With O-PTIR
Theoretical Spatial Resolution Comparisons (FTIR, QCL and O-PTIR microscopes)
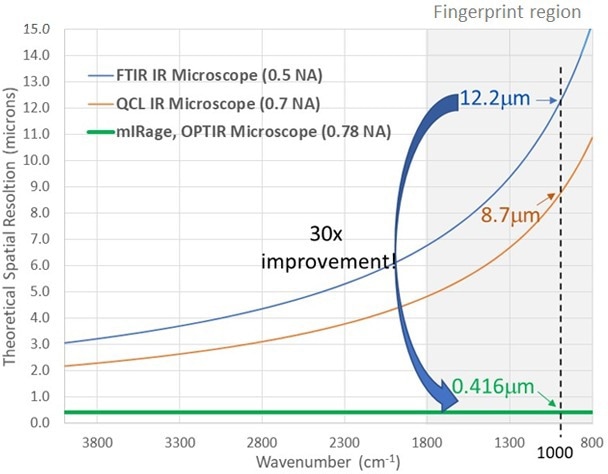
Image Credit: Photothermal Spectroscopy Corp
New “Dual Range (C-H/FP)” QCL
A new “Dual Range (C-H/FP)” QCL option is now available. This option covers the C-H stretch and fingerprint ranges (3000-2700, 1800-950 cm-1) in a single unit.
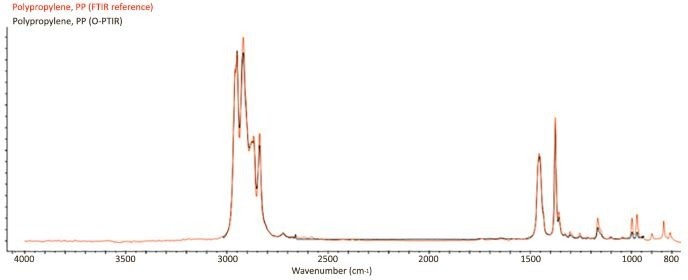
Library (Wiley KnowItAll) search results delivered >95% match. O-PTIR spectra collected in reflection mode. Displayed spectra are raw and unprocessed (<5 sec collection time, ~500 nm spot size). O-PTIR spectra are measured off thick polymers (mm’s), vs library FTIR references data off thin films (~10 microns). Image Credit: Photothermal Spectroscopy Corp