The new Widefield O-PTIR™ is a sub-micron IR, high-speed widefield chemical imaging mode for measuring a large array of autofluorescent and labeled samples primarily for bacterial, cellular, and tissue applications.
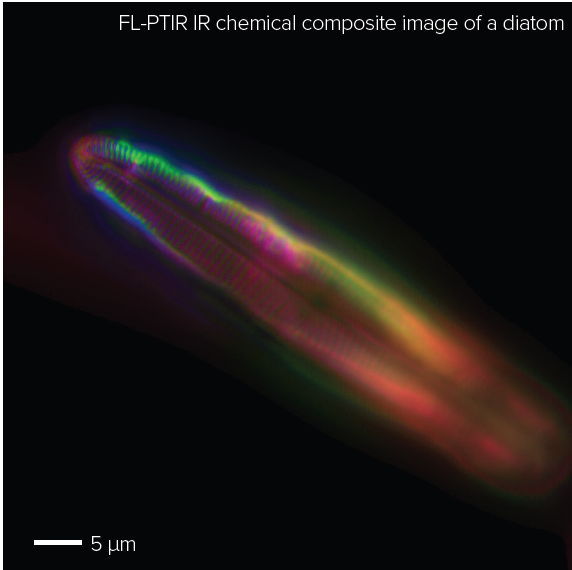
Figure 1. Diatom Widefield O-PTIR composite image. Refer to Figure 4 for spectra.
Diatom sample courtesy of Prof. K Gough, University of Manitoba, (MCR-ALS created in CytoSpec).
Get in touch now
Widefield O-PTIRTM chemical and concurrent fluorescence measurement provides:
- Imaging of fluorescently labeled and autofluorescent samples
- Individual wavelength chemical images in seconds and hyperspectral arrays in minutes
- O-PTIR imaging of unlabeled and IR-tagged samples
- Dynamic chemical imaging to a maximum of 5 frames per second
- Co-located fluorescence microscopy and sub-micron IR spectroscopy
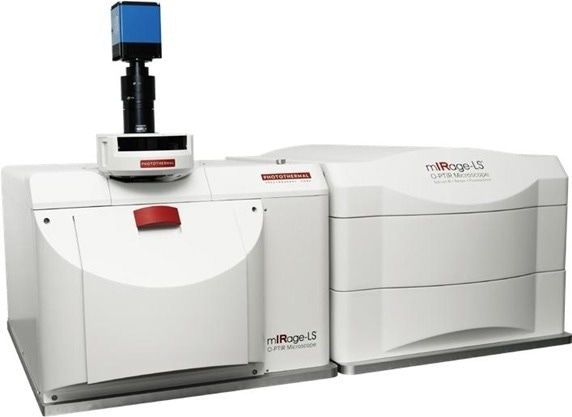
mIRage-LS with Widefield O-PTIR. Image Credit: Photothermal Spectroscopy Corp
Widefield Fluorescent-Infrared Microscopy with Sub-Micron O-PTIR Spatial Resolution
Widefield O-PTIR is driven by fluorescence-detected photothermal infrared (FL-PTIR), a new patented, widefield chemical IR imaging method built on an aggregation of fluorescence microscopy and Optical Photothermal Infrared (O-PTIR).
FL-PTIR utilizes alterations of a sample’s fluorescent emission intensity to find localized, chemically specific IR absorption at more than 260,000 spatially defined areas (pixels) on a sample in an instant, while offering concurrent and co-located widefield fluorescence imaging. Together, these advantages leverage the benefits of both methods for an array of tissue and cellular imaging applications.
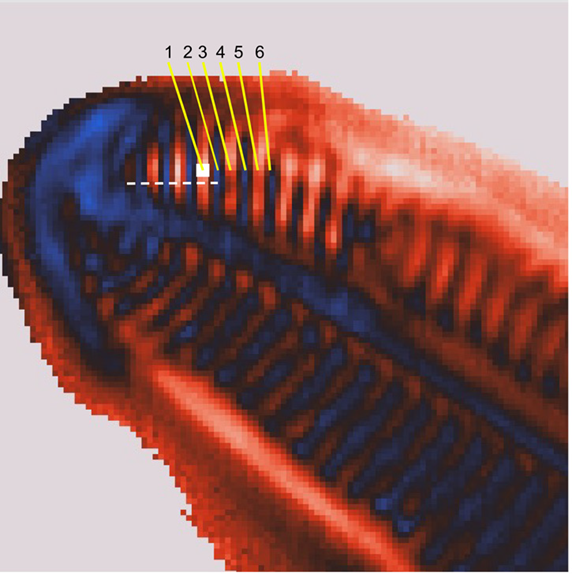
Figure 2. Diatom Image: Image ratio at 1200/1072 cm-1 with an 80 cm-1 peak integration width. The white box shows the size of 260 nm 2x2 pixel ROI used to calculate spectra in Figure 5. The dashed line shows the approximate location of the cross-section measurement in Figure 3. Image Credit: Photothermal Spectroscopy Corp
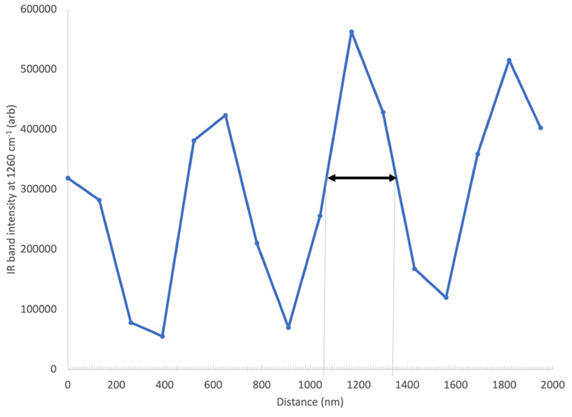
Figure 3. Demonstration of sub-500 nm spatial resolution. The plot shows the intensity of the white dashed line in Figure 2. Image Credit: Photothermal Spectroscopy Corp
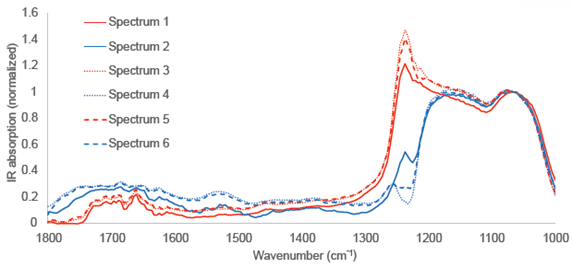
Figure 4. IR absorption spectra from 260 nm regions of interest with positions indicated in Figure 2. Note both the substantial spectral variation over 260 nm length scales and spectral similarity in the alternating regions of the periodic structures (striae) in the diatom frustule. Spectra are normalized to 1072 cm-1. Image Credit: Photothermal Spectroscopy Corp
Get in touch now
Label-Free, Fluorescently Labeled, Autofluorescent IR Tags
The potential for life science measurements is endless. Widefield O-PTIR has multi-modal abilities (O-PTIR, FL-PTIR, Raman, & Epifluorescence), which allows for measurements over a large spectrum of life science sample types, no matter if they are unlabeled, fluorescently labeled, or autoflourescent samples.
In addition, there are new Hyperspectra QCL laser developments in the silent region (2300-2000 cm-1), allowing the Widefield O-PTIR to also make use of the power of small molecule IR labels or tags, which further broadens the abilities for multi-modal vibrational spectroscopy in the field of life science research.
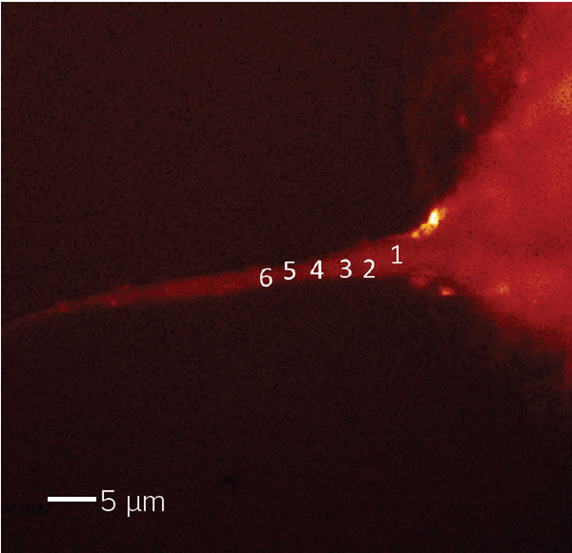
Figure 5. Collagen fibril, FL-PTIR autofluorescence image. Sample courtesy of K. Gough. University of Manitoba.
Autofluorescent, Label-Free Chemical Imaging
Autofluorescence has evolved from a major interferent to a significant enabler and sensitivity enhancer. Samples with high autofluorescence are ideal, as they can support rapid Widefield O-PTIR chemical imaging without adding exogenous fluorophores (e.g., fluorescent dyes/proteins).

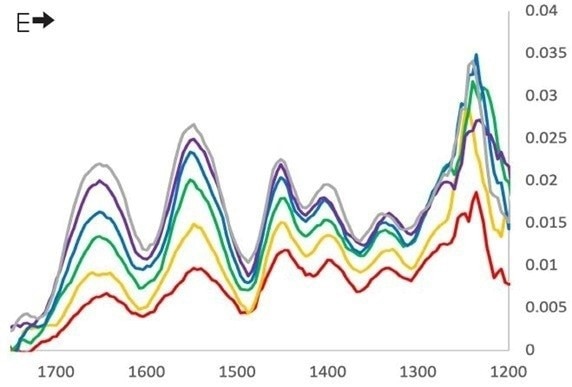
Figure 6. FL-PTIR spectra were extracted along the collagen fibril in Figure 5. Spectra were collected with vertical (top) and horizontal (bottom) IR polarization orientations. Image Credit: Photothermal Spectroscopy Corp
The Most Comprehensive Vibrational Spectroscopy Platform for Life Science Research
The mIRage-LS with Widefield O-PTIR provides specific vibrational spectroscopy and microscopy capabilities through O-PTIR, optional Raman spectroscopy, and integrated fluorescence microscopy. High-speed wide-field IR chemical imaging and high-speed single spectra abilities are enabled in a simple optical microscope-based platform.
System Specifications
Source: Photothermal Spectroscopy Corp
| . |
. |
| Widefield imaging area: |
Standard Range 65 μm x 65 μm (with 50x, 0.8NA objective). 262,144 total pixels (512x512) at 130 nm pixel size. Note that pixel size and field of view are dependent on objective magnification. |
| Imaging speed: |
Typical imaging speeds are application dependent, with single wavelength imaging speeds in seconds, resulting hyperspectral images created in minutes. Single IR wavelength dynamic imaging up to 5 FPS. |
Get in touch now

This information has been sourced, reviewed and adapted from materials provided by Photothermal Spectroscopy Corp.
For more information on this source, please visit Photothermal Spectroscopy Corp.