Fluorescence microscopy, with its powerful molecular specificity, has been a life science research workhorse technique for decades. Vibrational spectroscopy (IR and Raman) is a well-established technique that provides broad macromolecular, spatially resolved characterization capabilities for life science-based applications.
O-PTIR, with its sub-micron IR and simultaneous Raman capabilities, allows for broad macromolecular characterization on biologically relevant spatial scales (<500 nm), allowing for IR spectroscopy matched with simultaneous Raman and co-located IR and fluorescence imaging.
Researchers can now utilize these combined techniques with powerful synergy, accessing additional data and insights impossible with either method alone. This is a breakthrough for life science research as it is the first time both techniques are fully integrated and do not require sample registration on a single platform.
- <500 nm IR and Raman spatial resolution
- Co-located Fluorescence microscopy and sub-micron IR spectroscopy
- Simultaneous IR and Raman spectroscopy
- Non-contact reflection-based IR measurement with FTIR transmission-like spectral quality
- No IR spectral artifacts like Mie/diffuse scattering or specular reflection
- Live cell imaging (Fluorescence, IR and Raman)
Download the Brochure for More Information
Life Science – Cells
Co-Located Fluorescence + Sub-Micron IR of Cells
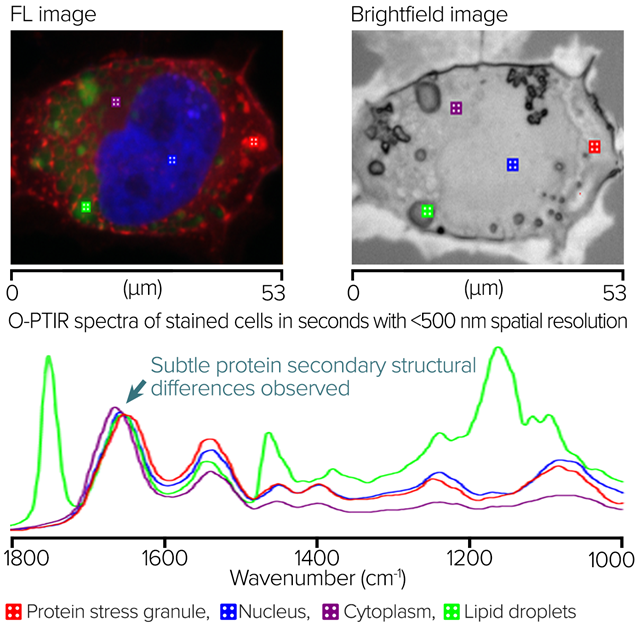
Image Credit: Photothermal Spectroscopy Corp
The image displays a widefield epi-fluorescence RBG overlay. Red highlights protein stress granules, blue highlights the nucleus, and green highlights lipids. Square markers show O-PTIR spectral collection locations. The brightfield image is displayed in the middle image. Square markers show O-PTIR spectral collection locations.
In seconds, the right side O-PTIR spectra were gathered from the marker positions in the left and middle panes. It is possible to see distinct spectral variations corresponding to the desired sub-cellular properties.
The slight change in the protein stress granule's Amide I band, which suggests that the protein secondary structure is probably distinct from the other locations, is particularly noteworthy.
O-PTIR Measurement of Cell in Water (H2O) with Water Dipping Objective
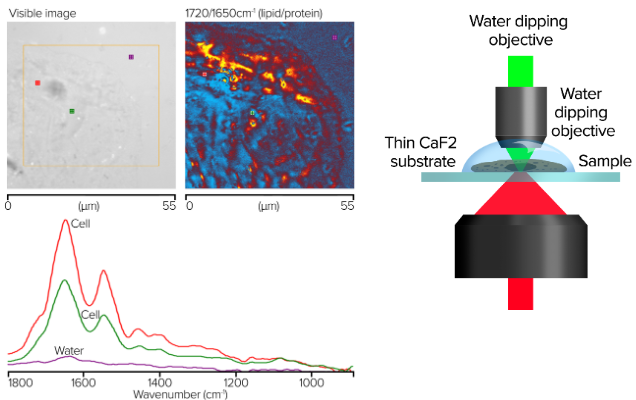
Image Credit: Photothermal Spectroscopy Corp
- Images collected in single frequency mode with 50 nm step size
- Spectra collected in seconds, images in minutes
- No water background compensation
- Spectra show little to no water absorbances
- Cheek cells in water on thin glass (~300 µm CaF2)
- Water dipping objective, 40×, 1.0 NA
O-PTIR of Fixed Cell with Oil Immersion Objective
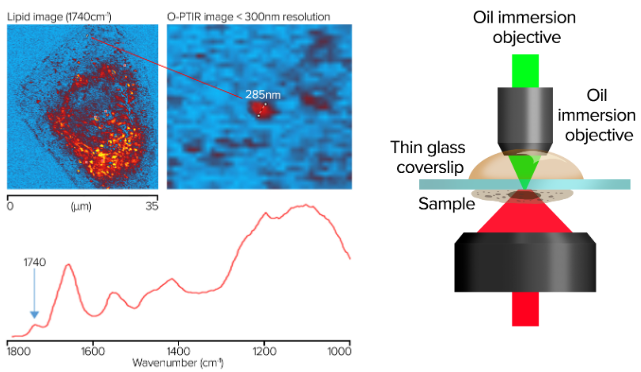
Image Credit: Photothermal Spectroscopy Corp
- Spatial resolution of ~285 nm for cell imaging
- Images collected in single frequency mode with 50 nm step size
- Spectra collected in seconds, images in minutes
- Cheek cells on glass coverslip (170 nm)
- Oil immersion objective, 100×, NA 1.30
Submicron Amyloid Aggregate Imaging in Neurons
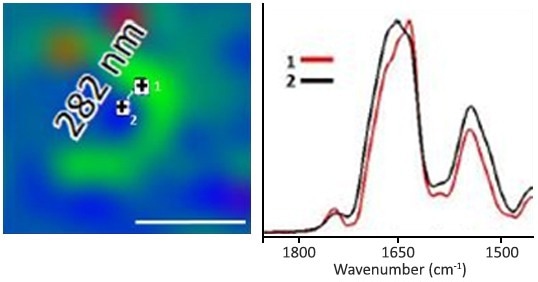
Image Credit: Oxana Klementieva et al., “Super-resolution infrared imaging of polymorphic amyloid aggregates directly in neurons”, Adv Sci, Adv. Sci. 2020, 1903004. https://doi.org/10.1002/advs.201903004
Left: O-PTIR, 1630/1656 cm-1 single frequency ratio image. This image displays the beta protein structural distribution with a 282 nm separation! The O-PTIR spectra from the IR picture (left) on the right indicate the spectra on (#1) and off (#2) of the beta protein structure.
Despite the mere 282 nm separating these two locations, spectral changes demonstrate the differences in the amide I band, typical of beta sheet-separated proteins.
Targeted Imaging Mode (Chemically Specific Imaging) Intra-Cellular Imaging, Off Glass Slide, at 100 nm Step Sizes
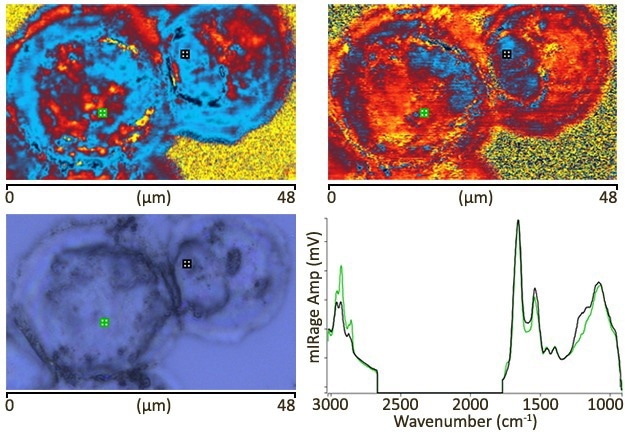
Image Credit: Sample courtesy of Prof Jose Sule-Suso, Keele University, UK. Publication in preparation (Dec, 2020)
The two IR images at in the top row were taken with pixels measuring 100 nm. The marker spectra are shown at the bottom right: single scans with a measurement duration of around one second and no processing. Data was obtained using the new “Dual range (C-H/FP)” QCL, covering the 1800–950 cm-1 and 3000–2700 cm-1 spectral ranges. Image time approx. five minutes for each image.
Life Science: Tissue
Using Fluorescence to Localize O-PTIR Measurements
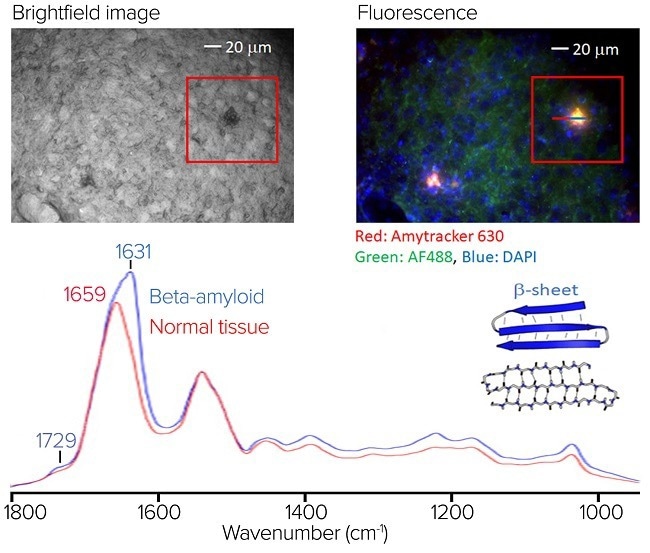
(top left) The brightfield image of the stained sample. (top right) The RBG composite fluorescence image. (bottom) An averaged O-PTIR spectra, from the line profile shown in the RBG composite fluorescence. image. Image Credit: Photothermal Spectroscopy Corp
An Alzheimer’s disease mouse model brain tissue section was stained with Amytracker 630 to identify amyloid aggregates, AF488 to highlight proteins, and DAPI for the nucleus.
The figure depicts a brightfield view of the stained sample.
The RBG composite fluorescence image, located in the upper right corner, reveals the regions of amyloid aggregation in red/orange. It is worth noting that some of the amyloid aggregates indicated in the fluorescence image are difficult to discern in the brightfield image.
At the bottom is an averaged O-PTIR spectra from the line profile seen in the fluorescence image, with spectra averaged on (blue) and off (red) the aggregate. The aggregate’s average spectrum reveals substantial spectral variances in the amide I band, including a large spectral feature at 1631 cm-1, indicative of protein beta-sheet structures.
This demonstrates the usefulness of combining submicrometer O-PTIR spectroscopy, which can then offer molecular compositional information. In this case, it is particularly sensitive to protein secondary structure, a characteristic strength of IR spectroscopy, with fluorescence imaging to highlight regions of amyloid aggregation, some of which cannot be readily seen in brightfield microscopy.
IR Polarized O-PTIR to Study Collagen Orientation in Individual Fibrils and Tendon
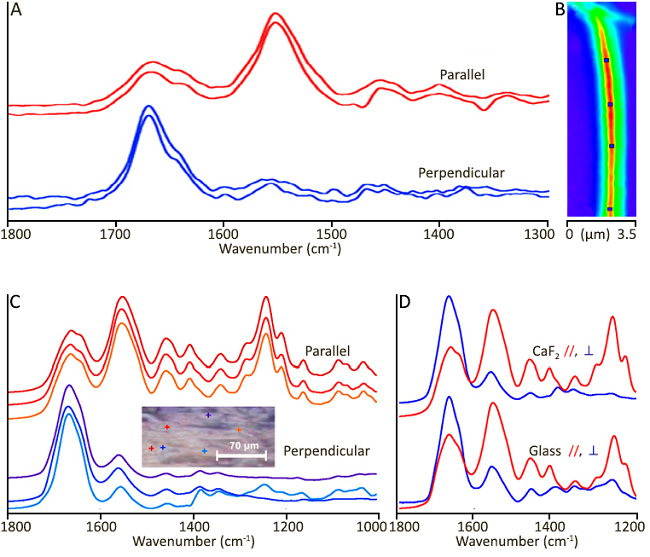
Image Credit: Gorker Bakir et al., “Orientation Matters: Polarization Dependent IR Spectroscopy of Collagen from Intact Tendon Down to the Single Fibril Level”, Molecules 2020, 25, 4295. https://www.mdpi.com/1420-3049/25/18/4295
A: O-PTIR spectra acquired from control tendon fibrils on the CaF2 window. B: The single-frequency image on the right was acquired at 1655 cm-1 in perpendicular orientation. Markers indicate locations from which spectra were obtained. The scale bar equals 1 µm. (B) Individual spectra were obtained from two orientations of a section placed on a CaF2 window in relation to the linearly polarized QCL. The included visual image depicts six locations within the FTIR FPA imaged region (scale bar = 70 μm).
C and D: Optical photothermal IR (O-PTIR) spectra from intact tendon at ~500 nm measurement locations.
Colored markers (+) in the image represent spectral colors. (C) A comparison of spectra from CaF2 (top) and glass (bottom) substrates in parallel and perpendicular orientations to linearly polarized QCL.
Breast Tissue Calcification – Demonstration of <1 Micron Spatial Resolution with O-PTIR
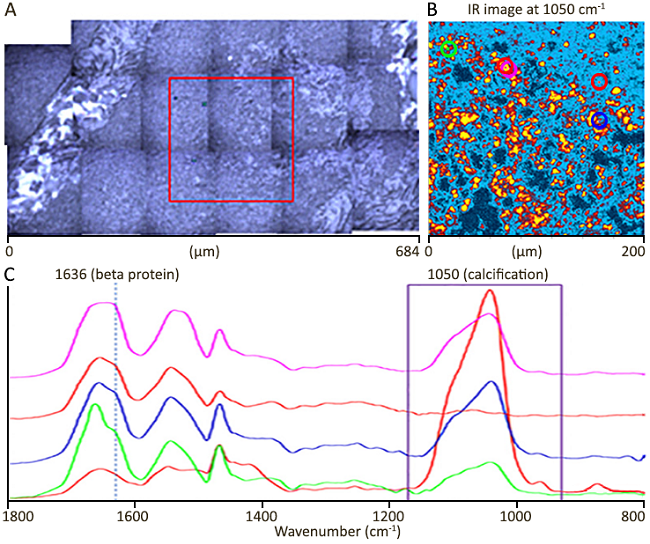
Image Credit: Sample courtesy of Prof Nick Stone, Exeter University, UK. Publication in preparation (Dec, 2020)
A: optical image (mosaic). The red box represents the IR image measuring region. B: A single frequency image at 1050 cm-1 to show calcification locations. C: O-PTIR spectra obtained from colored circle markers in IR image (B).
The IR imaging area is 200×200 microns, with a step size of 500 nm. Image time is around 10 minutes.
Calcification IR image at 1050 cm-1 resolves calcifications averaging only a few microns in size, with many measuring less than 1 micron. At 1050 cm-1, standard FTIR has a spatial resolution of ~12 microns, substantially bigger than the actual features. This is why such small and localized calcifications were not previously observed.
Download the Brochure for More Information
Life Science: Bacteria
Single Bacterial Cell O-PTIR Microscopy with Deuterium Labelled E. Coli
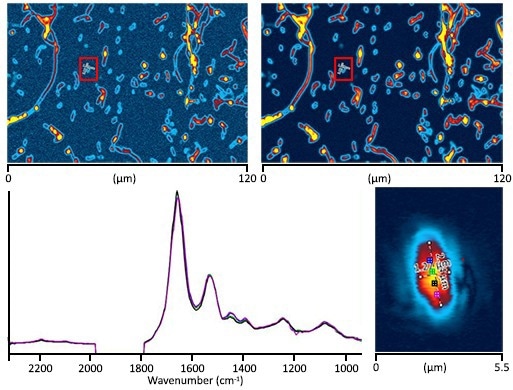
Image Credit: Photothermal Spectroscopy Corp
A: O-PTIR image at 1655 cm-1 (protein) with 200 nm step size. B: O-PTIR image at 2195 cm-1 (C-D stretch) with 200 nm step size. Both images took three minutes to obtain. C: A single E. Coli cell (2.6×1.3 microns) imaged at 1655 cm-1 with 50 nm steps. Image time: ~1 minute. D: Four submicron (~500 nm spot) O-PTIR spectra were obtained from a single bacterial cell image (Upper Right) with associated colors.
Spectra are standardized to 1655 cm-1. Intracellular changes can be seen in the location and shape of the Amide I band, which indicates intracellular chemical (protein secondary structure) differences. Each spectrum has 10 averages (about 15 seconds). Users can observe C-D absorbances at 2195 cm-1 and 2100 cm-1.
Single Bacterial Cell Simultaneous Submicron IR+Raman Microscopy
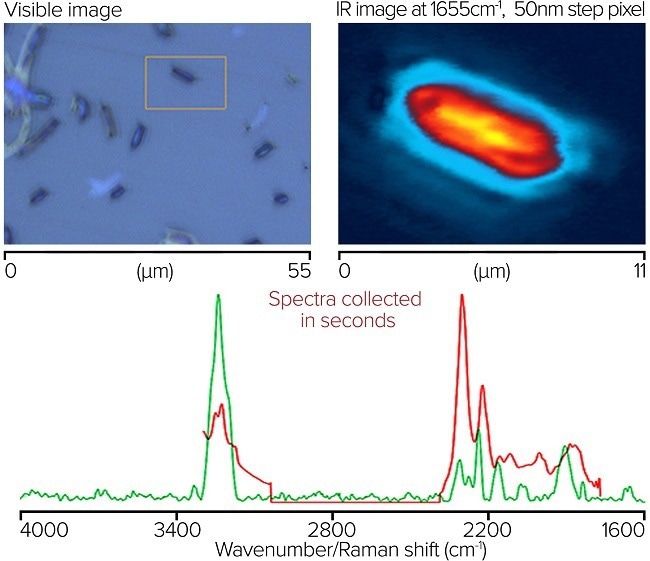
Image Credit: Photothermal Spectroscopy Corp
A: Visual representation of bacterial cells. An orange box shows IR imaging area. B: 50 nm step size O-PTIR infrared picture at 1655 cm-1. Time spent collecting ~1 minute. C: Concurrent submicron IR and Raman spectra obtained from the designated location on a single bacterial cell. Spectra are normalized to the most powerful band accumulations, which are ~20-second spectra.
A Dual Range (C-H/FP) QCL is used to gather O-PTIR spectra, encompassing 3000-2700 and 1800-950 cm-1 in a single instrument. The O-PTIR spectra are raw (no processing). Raman spectra are baseline corrected.
The OPTIR (~500 nm spot) has a signal-to-noise ratio of around 4000:1 (RMS, considering amide band intensity as the peak and baseline noise at the amide I location measured on a CaF2 blank) with ~20 sec accumulations.
Microplastics
Sub-Micron IR Shape and Size Independent Spectra
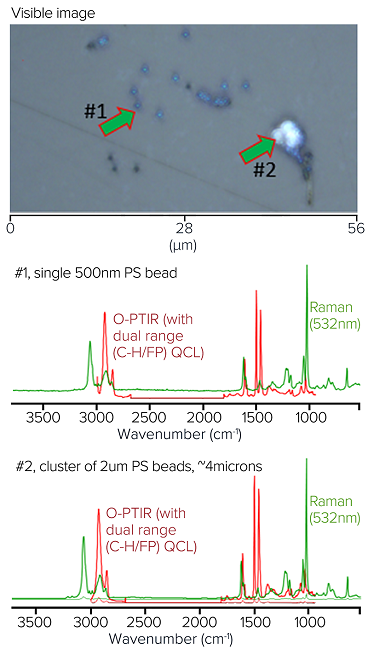
Image Credit: Photothermal Spectroscopy Corp
Photothermal created a mixed model sample of polystyrene (PS) beads (900 nm, 2 μm, 4.5 μm, and 10 μm) and poly(methyl methacrylate) (PMMA) to demonstrate O-PTIR's ability to measure particle shapes and sizes without artifacts in the presence of highly scattering salt crystals.
These particles would not only be too small to measure with an FT-IR/QCL system, but their range of sizes and salt crystals nearby would cause dispersive scatter artifacts that can significantly alter the spectra and complicate accurate identification.
The image illustrates these mixed polymer bead samples suspended in salt water and placed on a CaF2 substrate. The polymer beads would be scattered with salt crystals to further highlight the relative immunity to scattering artifacts.
Notably, all of the spectra appear to be quite consistent with the type of polymer they represent, even if they were obtained from beads of various sizes (i.e., dispersive scatter artifacts are absent). This guarantees accurate identification, independent of particle size and shape.
Fluorescence Imaging + O-PTIR of Microplastics
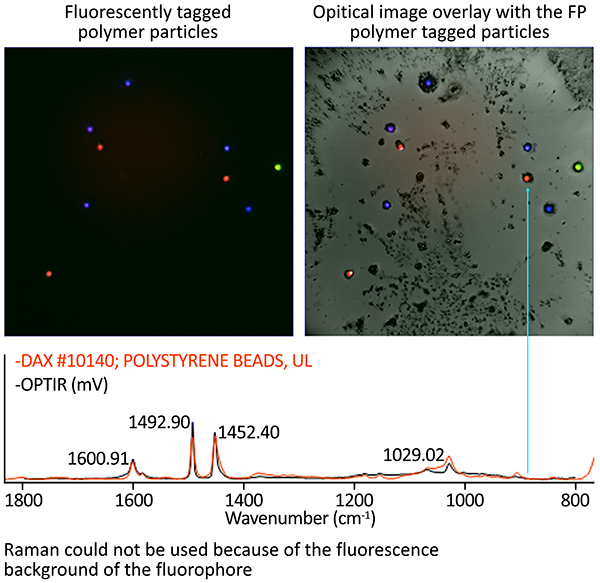
Image Credit: Photothermal Spectroscopy Corp
Polymeric bead fluorescence tagging can significantly expedite analysis by separating the polymer particles from other particles for O-PTIR measurement.
Sub-Micron IR+Raman Microplastics
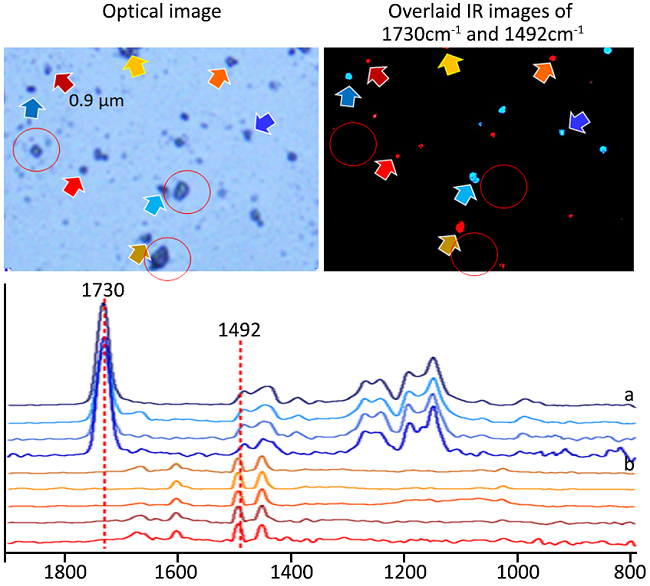
Image Credit: Photothermal Spectroscopy Corp
Using high-resolution IR images in critical absorption bands, mIRage locates PS (0.9 µm, 2.0 µm, 4.5 µm, and 10 µm) and PMMA beads (3.0 µm) in salt crystal mixture. Even in the presence of salt crystals at hotspots, distortion-free spectra can easily be compared to an IR database and validate the identity of the microplastics.
Crucially, when measured in reflection mode, no dispersive scatter artifacts and spectra are consistent regardless of particle size or shape, in contrast to conventional FTIR/QCL systems.
Polymers
Polymer Laminates Analysis with O-PTIR
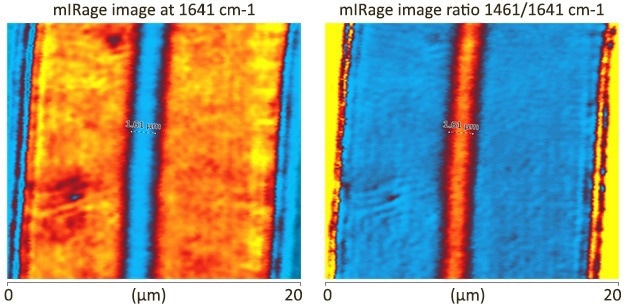
Image Credit: Photothermal Spectroscopy Corp
- Central EVOH layer of 1.6 microns clearly visible!
- Key peaks at 1642 cm-1 (Nylon) and 1142 cm-1 are used for single-frequency imaging
- Image collected at 100 nm steps (~3 mins per image)
O-PTIR – Polymer (PLA-ACM) Phase Dispersions
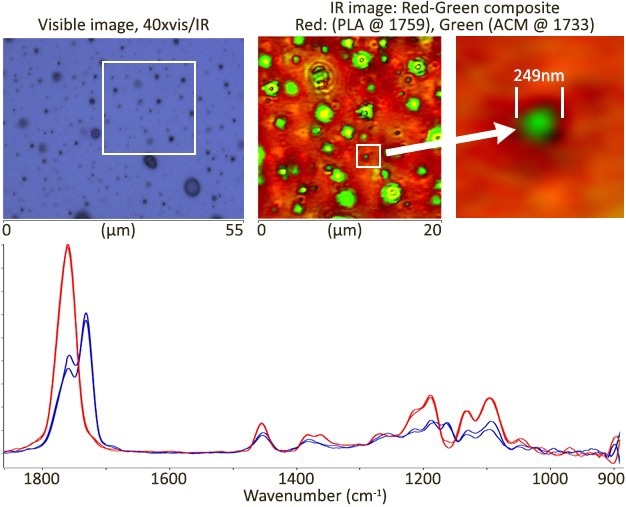
Image Credit: Sample courtesy of Dr Rudiger Berger, Max Planck Inst Polymer Research, Mainz, Germany
High spatial resolution images were obtained in minutes, while high-quality spectra were obtained in seconds. The image illustrates the image resolution of an ACM inclusion as tiny as 249 nm.
Clear spectral variations between PLA and ACM were discovered, indicating their expected chemical domains.
IR image: 20×20 um, 100 nm step size, ~3 min/image
Imaging and Spectroscopy of Bioplastic Laminates
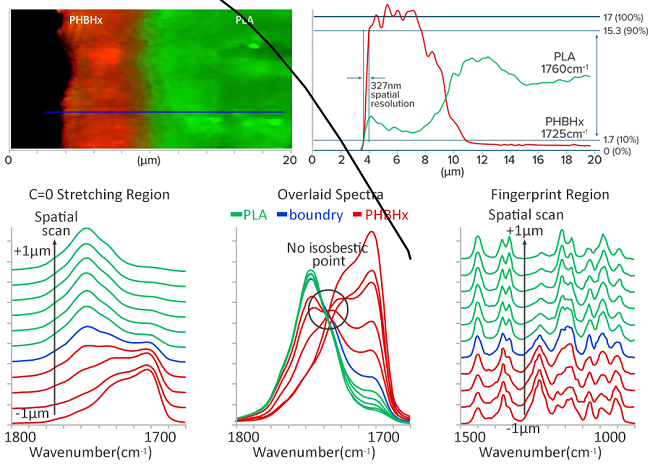
Image Credit: Photothermal Spectroscopy Corp
Moving from the pure PHBHx layer to the pure PLA layer, a linear sample scan measuring 8.0 µm across the boundary of the bioplastic laminate at 100 nm intervals (plotted only every 200 nm and across 2 µm for clarity) was conducted.
Gradual spectral shifts throughout a region far larger than the optical resolution point to a mixed distribution of PLA and PHBHx with no obvious boundaries.
No distinct isosbestic point indicates that the system is not a simple binary mixture.
 Download the Brochure for More Information