Sponsored by HORIBAOct 28 2013
The fingerprint provided by a vibrational Raman spectrum characterizes molecular and chemical structure. Although this spectroscopic data can be considered as similar in content, it is often better than that provided by IR spectroscopy, thanks to the superior spatial resolution of confocal Raman microprobes.
As an inelastic light scattering process, Raman scattering involves scattering of a laser photon by a sample molecule or crystal, during which the photon loses energy. Since the amount of energy loss is characteristic of the molecular bonding, the nature of the material being analyzed can be revealed in detail. It provides unambiguous, highly specific chemical identification in solid, liquid and gas phase without any laborious sample preparation.
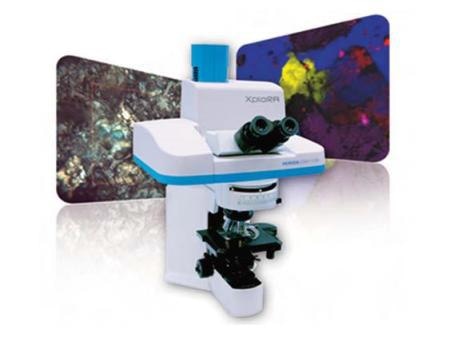
XploRA Confocal Raman Microscope
The XploRA Confocal Raman Microscope (Figure 1) from HORIBA brings chemical identification directly into a microscope by combining microscopy and high performance Raman spectroscopy. It is user friendly and transportable because of its smaller footprint. This makes it suitable for every forensic, QA/QC, and R&D lab. With this instrument, users can now analyze the true nature of a sample with rapid chemical imaging and compound identification. This non-destructive technique does not require any sample preparation and performs analysis in normal ambient conditions.

Figure 1. The XploRA Confocal Raman Microscope
Analysis of Pharmaceutical Compounds
Raman Spectroscopy is a robust and widely adopted analytical technique in the pharmaceutical market. The non-destructive technique provides versatile chemical identification rapidly within a small footprint benchtop instrument. In conjunction with an optical microscope, it provides the benefits of analyzing materials in small quantities such as single grains or crystals and monitoring the distribution of constituents across a sample. It can analyze excipients and active pharmaceutical ingredients (APIs) within seconds, and with comprehensive Raman spectral libraries, chemical identification can be easily done.
Furthermore, Raman spectroscopy can analyze subtle structural changes such as polymorphism and crystallinity, both of which can greatly affect drug dissolution and efficacy. Hence, gaining insights into the true nature of an API is vital for a successful drug development and production. Tablet mapping is a key requirement for Raman spectroscopy to assess tablet uniformity and analyze the grain size and distribution of APIs and excipients.
Mapping areas can range from a whole tablet to obtain an overview of the tablet through to a few tens of micrometers to provide an in-depth analysis of individual grains and phase boundaries. Latest technology like SWIFT imaging enables acquisition of these information rich maps within minutes/hours. Pharmaceutical tablets consist of many different ingredients in addition to the API, which is used for its therapeutic effects. These constituents are utilized to bulk out the tablet, offer lubrication during mixing and compaction, and facilitate digestion.

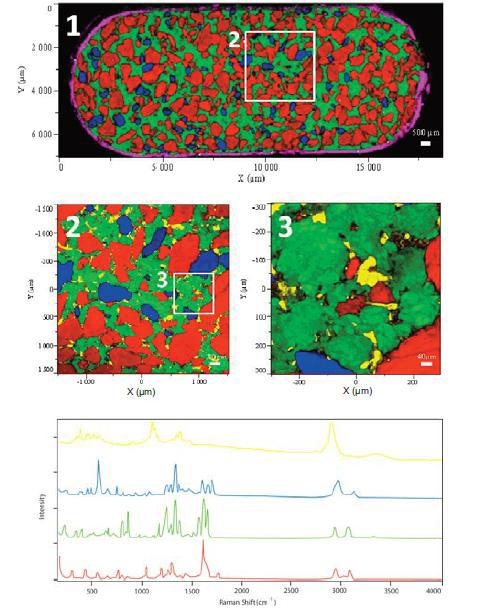
Figure 2. Color-coded Raman images of a pharmaceutical tablet highlighting the spatial distribution of the various components at different scales
Here, the acquisition of Raman fast mapping data from an aspirin-containing painkiller is shown (Figure 2). The acquisition of three Raman maps ranges from a low-resolution large area image of a full tablet through a high-resolution small area image to provide in-depth analysis of individual grains/particles. The whole tablet map (1 of Figure 2) comprising 50,901 pixels over a 7 x 18mm2 area reveals components (aspirin, paracetamol and caffeine) as well as the tablet coating.
A higher resolution image (2 of Figure 2) shows the presence of a fourth component (cellulose) widely across the tablet, but only small, discrete areas. The final image (3 of Figure 2) acquired with 2µm step (90,601 data points) allows for observing the size and shape of individual cellulose grains. Figure 2 also shows spectra from these four major constituents.
Conclusion
The results clearly illustrate the ability of Raman Spectroscopy to distinguish the components of a tablet with ease.

This information has been sourced, reviewed and adapted from materials provided by HORIBA.
For more information on this source, please visit HORIBA.