Table tops are used as a platform for conducting several types of processes and measurements. They can be used as a mechanical reference between different components (such as lenses, lasers, film plates, etc.). In addition, table tops provide a quiet work surface.
Tops are constructed using a composite laminate, or a lightweight honeycomb, or a solid material (granite). The choice of construction depends on the size and type of the application.
A typical laminated construction is shown in Figure 1. Usually 2 to 4 inch in thickness, these are made up of layers of steel and/or composite materials epoxy-bonded together into a seamless stainless steel pan with rounded corners and edges. To improve the damping of the composite layers, a visco-elastic adhesive is used between the plates.
The bonding materials are selected to prevent delamination of the assembly caused by aging, heat, or humidity. The pan is made up of ferromagnetic stainless steel, and provides a durable, corrosion-resistant surface which is compatible with magnetic fixtures.
Usually, tops weigh 100 – 5,000 lbs, and are available in standard sizes ranging from 24 x 24 in. to 6 x 12 ft. Laminated construction is not appropriate for applications requiring many mounting holes (tapped or otherwise). The ratio of steel to lightweight damping composite in the core is depends primarily on the desired mass for the top.
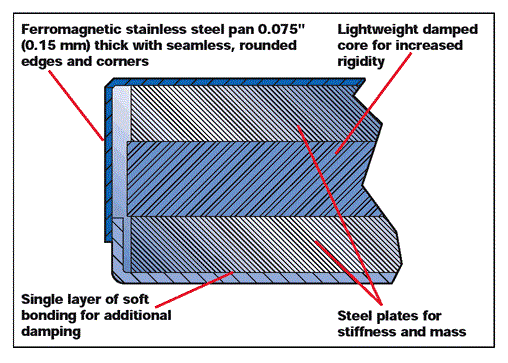
Figure 1.
A heavy top is beneficial to several types of applications. It can lower the center-of-gravity for systems where gravitational stability is a concern. When the payload happens to be dynamically “active” (e.g. a microscope having a moving stage), then the heavy mass can reduce the top’s reaction motions. Finally, steel is quite strong, and very heavy payloads need this strength.
Solid-composite and granite tops provide a relatively high mass and stiffness, offer moderate damping levels, and are cost-effective in smaller sizes. Their non-magnetic properties are helpful in several applications, and they can also be lapped to a precise surface.
However, mounting to granite surfaces is not easy, and granite is more expensive and less well-damped when compared to laminate tops in larger sizes. Honeycomb core tables are the highest performing work surfaces.
Honeycomb Optical Tables
Honeycomb core table tops are rigid but light in weight, and are used for applications needing larger working surfaces or bolt-down mounting. They can be made in sizes ranging from 1 ft on a side and a few inches thick, to 5 x 16 ft and over 2 ft in thickness.
Also, larger tops can be “joined” to realize a surface with almost unlimited size or shape. The smaller surfaces are commonly referred to as “breadboards,” and the bigger ones as “optical tables” or “optical tops”.
Initially developed for high-precision optical experiments such as holography, honeycomb core tables were developed because of the constraints associated with granite surfaces, which were extremely heavy and expensive in larger sizes, and were difficult to mount objects to securely. The objective was to realize a working surface with the stability of granite but without these drawbacks.
As a structural “I” beam, the honeycomb core tables are also rigid. An I-beam features a vertical “web” which holds a top and bottom flange. As weight is loaded on to the beam, the top flange is compressed and the bottom is stretched, since the web constantly maintains their separation.
The beam’s primary stiffness is due to the compression and extension effects of the flanges. The web also adds to the stiffness as it resists shear in its plane.
A similar effect is noticed in an optical table, as shown in Figure 2. The skins of the table provide high resistance to being compressed or stretched (like the flanges of the I-beam). The honeycomb core resists compression along its cells (which serve the same role as the web in an I-beam).
When the core density increases (cell size decreases), the compressional stiffness of the core and its shear modulus are increased, and the mechanical coupling to the skins is improved, enhancing the core table’s performance.
Optical tables have better thermal properties compared to granite surfaces. Due to their metallic construction and low heat capacity (because of their relatively light mass), honeycomb core tables achieve thermal equilibrium with their environment faster than granite tops. This leads to less thermally induced distortions of the working surface.
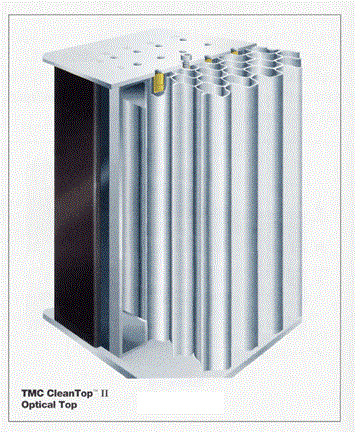
Figure 2.
Optical Cable Construction
A honeycomb core also provides several other benefits. A range of mounting holes can be placed on the table’s surface due to the open centers of the cells. The holes can be capped for preventing the entry of liquid contaminants into the core and preventing them to be “registered” with the core’s cells.
During the construction of TMC optical tops, the top skin is kept face down against a reference surface (a lapped granite block), and the sidewalls, bottom skin, epoxy, core, and damping system are built up on top of it. 30 tons of force is used to clamp together the whole assembly.
This forces the top skin to conform to the same shape (flatness) of the precision granite block. When the epoxy is cured, the top skin of the table maintains the flatness (typically ±0.005 in.) over its full surface.
TMC’s patented CleanTop®II design enables the core to be bonded directly to the table’s top and bottom skins. This improves the core’s compressional stiffness and shortens the thermal relaxation time for the table. The epoxy that is used for bonding the table is quite rigid and non-brittle, and permits thermal contraction and expansion of the table without affecting the bond between the skins and the core.
Honeycomb core tables can be constructed from various materials, including aluminum for magnetically sensitive applications, non-magnetic stainless steel, and super invar for applications requiring high thermal stability. The individual cups sealing the holes in the top skin (which is a feature novel to TMC’s patented CleanTop® II design) are made up of nylon or stainless steel to resist various corrosive solvents.
Many materials can be used to construct the sidewalls of the optical table. Some of TMC’s competitors’ table tops use a common “chipboard” sidewall which is well damped, but not very strong and can be easily damaged during handling or by moisture.
TMC tables have an all-steel sidewall construction with constrained-layer damping effect to provide high damping levels and high mechanical strength.
Honeycomb Optical Table Performance
An optical table’s performance is defined by its static and dynamic rigidity. Both define how the table is flexed when it is subjected to an applied force. The first property is the table’s response to a static load and the second one describes the “free oscillations” of the table.
Figure 3 illustrates the measurement of static rigidity of a table. The table is held on a set of line contact supports. The table’s deflection (δ) is measured when a force is applied on the center of the table. This provides the static rigidity in terms of µin/lbf (or µm/N). The table’s dimensions and the physical properties of the top and bottom skins, core, sidewalls, and their assembly, determine the rigidity.
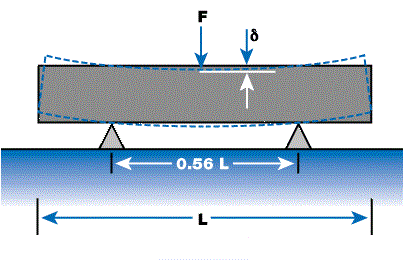
Figure 3.
The Corner Compliance Curve
The measure of the peak-to-peak motion of oscillations of a table after it is excited by applied impulse force is known as dynamic rigidity. When struck with a hammer, many normal oscillation modes of the table are excited, and each node “rings” with its own frequency.
Figure 4 illustrates the four lowest frequency modes of a table. By hitting the corner of a table with an impact testing hammer (which can measure the level of the impact force near the corner of the table), dynamic compliance can be measured.
The response of the table is measured with an accelerometer tied to the top proximal to the location of the impact. The signals are transmitted to a spectrum analyzer which generates a corner compliance curve. This measures the deflection of the table in µin/lbf (or mm/N) for frequencies of 10 – 1,000 Hz.
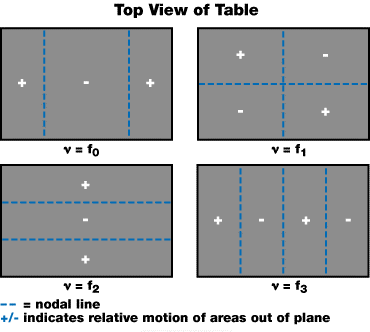
Figure 4.
Every individual normal mode resonance of the top appears as a peak in this curve at its resonant frequency. The standard way to describe the dynamic compliance of a table top is to give the peak amplitude and frequency of the lowest frequency peak (which generally dominates the response). Figure 5 depicts the compliance curve for a table with low damping levels (to stress the resonant peaks).
The peaks correlate to the modes shown in Figure 4. The curve with a slope of 1/f 2 is sometimes erroneously referred to as the “mass line,” and represents the rigid-body motion of the table.
“Mass line” is misleading as the rigid-body response of the top involves translational and rotational degrees of freedom, and, therefore, also involves the table’s two moments of inertia as well as its mass. For this reason, the line may be 10 times or more above the line that would calculate using the table's mass alone.
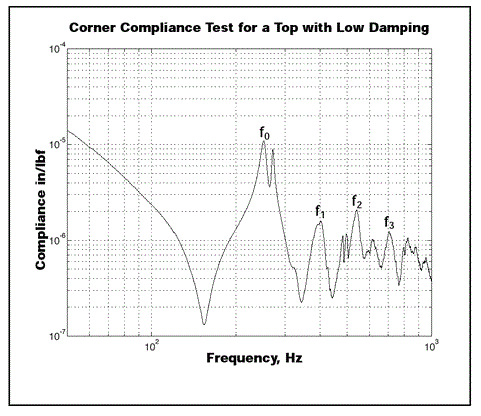
Figure 5. F0-f3 show the four lowest resonances of the table
The compliance curve is primarily used to illustrate how well a table is damped. If the damping level is high, the peak in the compliance test will be low, and the table will ring down more rapidly post-impact disturbance. Narrow-band and broadband damping are the two ways to damp a table’s modes.
The first method uses tuned mechanical oscillators matched to the frequencies of the normal mode oscillations to be damped. Every matched oscillator removes energy at a single frequency. TMC uses broadband damping where mode damping occurs by coupling the table to a second mass by a lossy compound. This damps all frequencies and all modes.
Tuned damping can cause several issues. If the frequency of the table changes by placing some mass on it, then the damper can lose some of it's effectiveness. Additionally, multiple dampers must be used, one for each mode (frequency) of concern, which can aggravate the matching problem.
Each damper is mounted in different corners of the table, leading to different compliance measurements for each corner of a table. As a result, the quoted compliance curve may be applicable to only one of the four corners of a table top. Additionally, tuned dampers are constrained in how far they can decrease the Q. It is not easy, for instance, to achieve within a factor of 10 of critical damping using reasonable-sized dampers.
The secondary masses are spread out uniformly throughout the table in broadband damping, producing a compliance curve that is corner-independent. It is also not sensitive to changes in table resonant frequencies and can damp all modes - not just those that have matched dampers.
TMC’s highest grade tables can have near-critical damping of the lowest modes (depending on thicknesses, aspect ratios, etc.).
Compliance Curves as a Standard
The corner compliance curve is an ambiguous figure of merit, although it is taken as a standard to measure table performance. One of the problems is with the tables using tuned damping. The measurements are quite sensitive to the monitoring sensor and the precise location of the test impact.
TMC measures compliance curves by keeping the sensor in a corner 6 inches from the sides of the table and impacting the table on the inboard side of the sensor. As the table’s core is recessed from the table’s edge by 1-2 inches, impacting the table proximal to the corner generates “edge effects.” This results in a test that is inconsistent from corner to corner or impact to impact.
Alternatively, measuring further from the corner can make the sensor and the impact point dangerously close to a nodal line for the first few modes of the table, as seen in Figure 4. This is very sensitive as a few inches will produce a dramatic effect on the measured compliance for a table top.
The table being tested needs to be properly supported. TMC provides support to tables at four points, along the two nodal lines 22% from the table’s ends. Pneumatic isolators or extra rigid rubber mounts can be used for this test (although rubber mounts may alter the damping of higher-order modes).
Although this is a fairly common feature with manufacturers, customers need to understand that the compliance test will only represent their setup if they support their top in this manner.
Nodal shapes cause problems in the uniformity of the corner compliance curve as a standard figure of merit, as there is no government or industry standard for testing (like TMC’s 6 inch standard for sensor locations).
Part of the problem concerns the measurement point (near nodal line(s) for the modes) which is a position in which the resonance amplitude shows maximum variance: from zero at the node to a maximum at the table’s edge. Hence, the ideal place to obtain a compliance measurement would be a location in which the mode shape is “flat.”
For instance, the location could be the center of the table for the first mode as shown in Figure 4. In this case, the measurement is almost independent of the sensor or impact locations for the first mode only. However, for several higher modes, this is dead center on nodal line(s), generating insignificant results.
The corner compliance test has become the standard, avoiding bombarding customers with separate tests for each mode shape.
More recently, some efforts have been made to produce other figures of merit. TMC does not use these because they increase the uncertainty of the compliance test with many other assumptions. The so-called “Maximum Relative Motion” and “Dynamic Deflection Coefficients”* take information from the compliance curve and combine it with an assumed input force spectrum.
Unfortunately, the “real” relative motion observed also depends on the way the table is supported. If, for instance, the top is properly supported by the isolators at the nodal lines of the lowest mode (0.53 L apart), then little excitation of the lowest mode from the isolators (on which these figures of merit are based) takes place.
Similarly, if a top is improperly supported, the mode can be driven to large amplitudes. Additionally, the “assumed” input depends on two poorly defined factors: isolator efficiency and floor noise.
Even if these factors are well defined, it is expected that acoustic sources of noise would dominate at these frequencies (usually 100 - 1,000 Hz). For the above reasons, these alternate figures of merit could be considered meaningless and of not much use.
References and Further Reading
* These particular figures of merit were developed by Newport Corporation of Irvine, CA.
This information has been sourced, reviewed and adapted from materials provided by TMC.
For more information on this source, please visit TMC.