Utilizing the technique called focused ion beam – scanning electron microscopy (FIB-SEM), a study investigated the high capability thin-film solar cells which are made of Cu(In,Ga)Se2. Samples were sectioned by contrasting substrates and processed by FIB to assess the interior cellular components.
Ductile or polymer substrates are typically very challenging to prepare utilizing the traditional methods, however, this mechanism is extremely effective upon these samples. Scanning transmission electron microscopy (STEM) displayed the minute details of both anterior and posterior electrodes, allowing the use of energy dispersive spectroscopy (EDS) analysis of <10 nm spatial resolution. Additionally, alkali diffusion from the substrate entering the cell was confirmed utilizing secondary ion mass spectroscopy (SIMS).
Introduction
The photovoltaic effect is defined as the process by which solar cells translate energy from the sun into electricity. Almost 1.8 percent of all the globally required electricity was created utilizing this approach in 2016 [1]. This is forecast to dramatically increase as mechanisms of green energy become cheaper.
Typically, crystalline silicon is used as the active material to create solar cells on a commercial scale. However, thin-film cells can also be used. This method uses a thin film as the absorbing component, which can have a diameter on a scale of nanometers to micrometers. Overall, this method has several advantages, such as cheap manufacture and low weight. Also, the use of such a thin absorber means that malleable and translucent cells can be made – allowing applications which were previously not possible.
Present day thin-film copper indium gallium selenide (CIDGd) solar cells have very efficient levels of over 22% [2], matching the capabilities of up-to-date solar cells composed of polycrystalline silicon. Further improvements aim expand this efficiency level, using electron microscopy to examine the solar cells on a microstructure level with very high resolution.
This article aims to detail various experimental approached which allowed for an in depth materials characterization of the CIGS solar cell, utilizing ZEISS Crossbeam.
Cross-Section Imaging
To assess the distinct basic layers of CIGS solar cells, samples were sectioned and prepared. In this experiment, CIGS cells were cleaved and positioned upon glass. Overall, the cell was composed of a glass substrate, a molybdenum back electrode, the CIGS absorber, a CdS buffer layer, a minute layer of ZnO, and a denselayer of aluminum-doped ZnO.
Cleavage is an appropriate technique for strong substances, such as glass, however ductile substrates which are often used in novel applications cannot be sectioned in this manner. Instead, these samples are prepared through tearing. This, however, may lead to stratification of the layers which can make location of intact layers both challenging and time consuming. This is may also be the case for cleavage of samples.
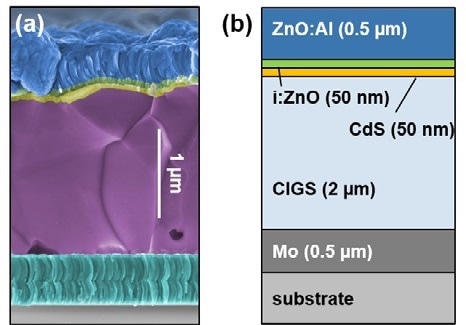
Figure 1. (a) Colored SEM image of cleaved CIGS sample. (b) Schematic of the standard structure of a CIGS solar cell.
An alternative method for in situ cross section preparation for FIB-SEM provides a useful substitute for the examination of all CIGS cells, without requiring presence of a substrate. Initially, the sample is positioned at a 54° slant, facing the FIB beam. This ensures that the FIB beam is at a right angle to the sample surface and can cut a trench at a highly specific site of interest. SEM examination can be carried out both after and during the FIB milling as the sample is positioned at a junction between the FIB and SEM beams. In this experiment, the cross section was 20 µm in width and had a large depth which revealed the entire layer stack. Overall the sample was prepared in under 10 minutes.
Four different substrates (glass, alumina, steel, and polyimide were) were used to hold CIGS cells, cross sectioned and prepped. The same milling parameters were applied to each sample, which illustrates the wide application of the FIBSEM method. Further preparation of the steel cell involved the covering of the conducting substrate with 2.5 µm of insulating SiOx.
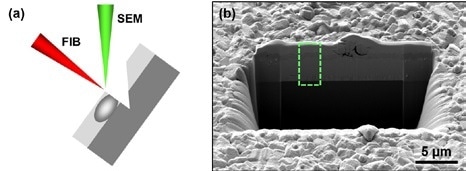
Figure 2. (a) Schematic showing the arrangement of the sample, and FIB and SEM beams during FIB-SEM cross sectioning work. (b) SEM overview image of a cross section in a CIGS solar cell on glass. The area within the green dashed frame is shown in more detail in Figure 3.
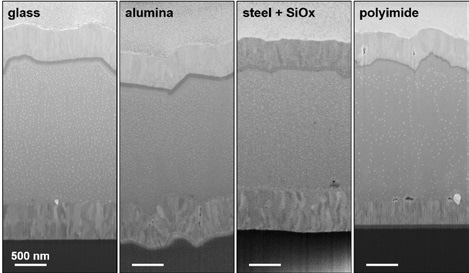
Figure 3. Cross sections of CIGS solar cells on different substrates. The substrates are, from left to right: glass, alumina, SiOx on steel and polyimide.
The observed samples had a distinct speckle pattern when observed on each CIGS layer. These speckles are were identified to be copper-rich beads as found by Abou-Ras et al. [3]. This study identified that these droplets were formed due to the separation of Copper, as the copper was concentrated at the cross-section surface in combination with large surface diffusion. This droplet composition can be reduced through the application of reactive gases during the milling process, or by milling at cryogenic temperatures.
STEM Imaging
To demonstrate the STEM process, a lamella from the CIGS on alumina sample was prepared. Electron clarity of this sample was obtained by a finishing FIB polishing step at 5 kV energy.
Overall, the resolution obtained from this sample was much higher and different contrasts can be analysed. Elemental ZnO within the ZnO lay was distinguished from the Al-doped ZnO due to contrasting morphology of the grains. Whereas the grains in the Al-doped ZnO are elongated, the grains in the intrinsic area are very small.
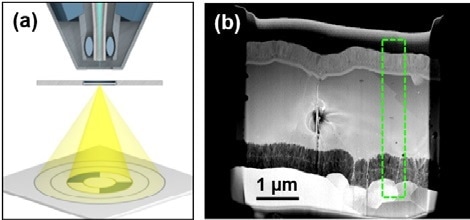
Figure 4. (a) Schematic showing sample and detector during STEM. (b) Overview STEM image of a CIGS solar cell on alumina.
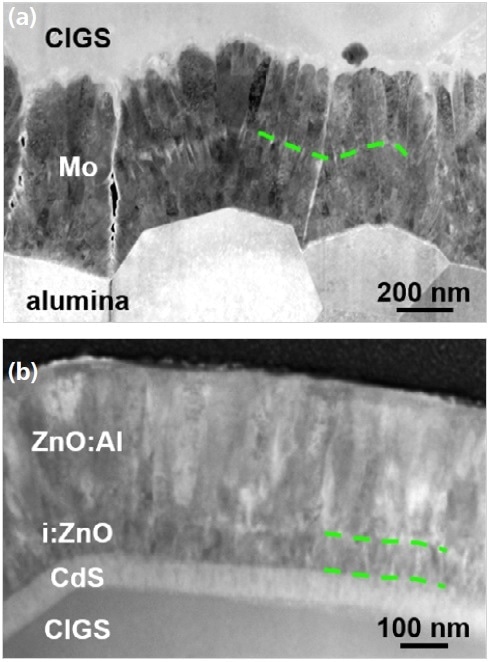
Figure 5. (a) Detail of Mo back contact. The dashed line shows the internal interface. (b) Detail of ZnO layer. ZnO:Al and i:ZnO show a different grain structure. The dashed lines denote the limits of the i:ZnO layer.
High Resolution EDS
A minute region of the lamella was EDS mapped. This was carried out at 15 kV SEM landing energy utilizing an EDAX Octane Elite Super EDS machine and these results were then represented using different colors, which communicated Pt M, Zn K, Cd L, Se L, Mo L and O K lines and show a characteristic signature for each of the differing different layers.
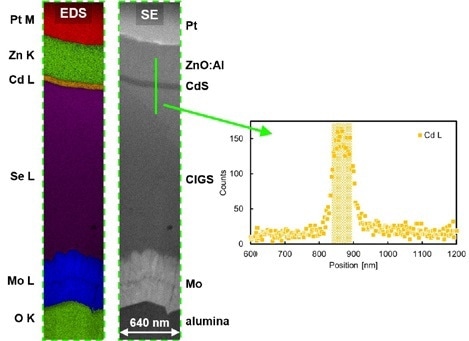
Figure 6. EDS mapping of an area of a CIGS on alumina lamella. The inset shows the Cd L EDS signal as a function of position for the line shown in green.
EDS mapping allows CdS layers with over 58 nm depth to be resolved effortlessly. In this study, a line scan from this specific layer was obtained from the obtained data and the Cd L counts were represented as a graph plotted as a function of position. The obtained graph was then utilized to approximate the spatial resolution of the EDS measurement. This was identified to be well below 10 nm, which agreed with an alike experiment which was carried out at an earlier point, analysing a different material system [6].
Secondary Ion Mass Spectroscopy
Very small amounts of alkali elements, for example sodium (Na) and potassium (K), within the active material of CIGS have been identified to increase the efficiency of the solar cell [2]. During growth, these elements disperse out from the substrate to the CIGS . However, EDS cannot detect these very low concentrations as it is not sensitive enough. To detect these elements, a secondary ion mass spectrometry (SIMS, Hiden Analytical EQS 1000) assay was carried out in the FIB-SEM.
A small region of the prepared sample was gradually removed by FIB. Whilst the milling process was carried out, secondary ions were sputtered from the sample. These ions are then transferred into a mass spectrometer and investigated, measuring their mass to charge ratio (m/q). The amount of quantifications for one or more specified m/q value can be recorded as a function of the milling cycle. With a rise in the milling cycle number deeper regions of the sample can be investigated.
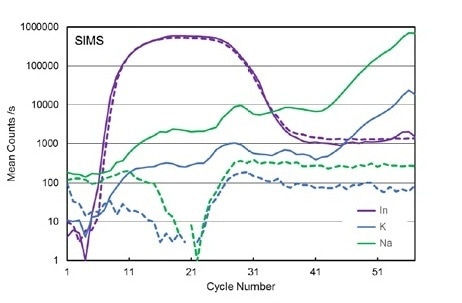
Figure 7. SIMS depth profiles for In, K, and Na for two CIGS solar cells with different substrates: glass (solid lines) and alumina (dashed lines).
In a study, two SIMS depth profiles, as previously described, were analysed for the CIGS on glass and the CIGS on alumina samples. These samples had identical parameters and their elemental depth profiles are also almost identical. However, this is not observed when measuring Na and K signals. When measuring the glass substrate sample, both K and Na signals are increasingly strong from the substrate up to the ZnO layer when compared to the alumina sample. However, it has been hypothesised that this is due to the alkali elements present within the glass sample.
In this study, quantitative determination of the concentration of both Na and K was not carried out. This is due to the large difficulty with this quantification, as secondary ion produce rely largely upon the encircling matrix (matrix effect). As a result, it is essential to function with standards, i.e. CIGS samples with well-defined alkali concentrations. However, this was not carried out in this work, as only a proof of principle was intended to be investigated.
Conclusion
Therefore, FIB-SEMs are vitally important tools within the investigation of material microstructure measurement. This article has shown this through the use of the CIGS solar cell as a model.
References:
- Snapshot of global photovoltaics market 2017, Report International Energy Agency (2017), pp. 6.
- T. Magorian Friedlmeier, High efficiency Cu (In, Ga) Se2 solar cells, Thin Solid Films 633 (2017), pp. 13 - 17.
- D. Abou-Ras et al., Enhancements in specimen preparation of Cu (In,Ga) (S,Se)2 thin films, Micron 43 (2012), pp. 470 – 474.
- G. Pavia, An Annular Detector for ZEISS FE-SEMs and Crossbeams, ZEISS Technology Note (2015), available online.
- T. Wada et al., Characterization of the Cu(In,Ga)Se2/Mo interface in CIGS solar cells, Thin Solid Films 387 (2001), pp. 188 - 122.
- D. Willer and F. Pérez-Willard, High Resolution STEM and EDS Study of Chromium Depletion in Stainless Steel, ZEISS Application Note (2015), available online.

This information has been sourced, reviewed and adapted from materials provided by Carl Zeiss Microscopy GmbH.
For more information on this source, please visit Carl Zeiss Microscopy GmbH.