Students from Sydney Grammar School recreated the drug Daraprim®, also referred to as pyrimethamine. This news was extensively reported† in December 2016.
The students produced the drug by following a reaction pathway, and the end product was analyzed at the University of Sydney, School of Chemistry (200 MHz 1H NMR spectrum illustrated in Figure 1)‡.
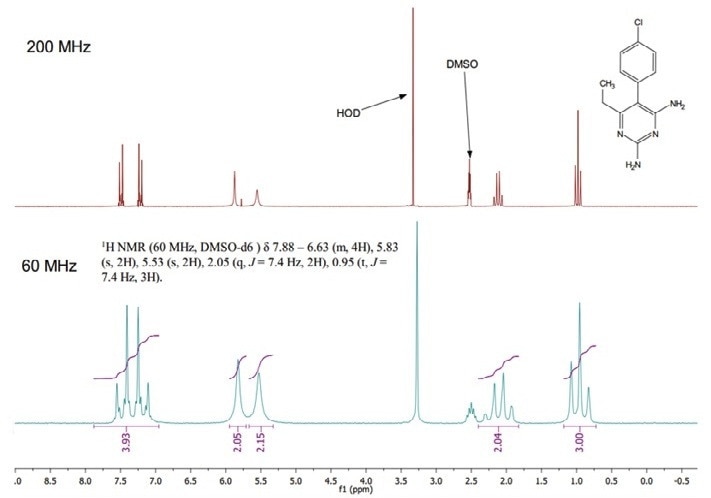
Figure 1. 1H NMR spectra of pyrimethamine at 200 MHz (top) and 60 MHz (bottom). Sample details at 60 MHz = 16 scans. Approximately four minutes acquisition, 13.5 mg in 0.5 mL DMSO-d6 = approximately 100 mmol dm-3 concentration.
†The Guardian/Melissa Davey. 2016. Australian students recreate Martin Shkreli price-hike drug in the school lab.
‡Open Notebook Science Network/Alice Williamson. 2016. Open Source Malaria Daraprim Synthesis. [ONLINE] Available at: http://malaria.ourexperiment.org daraprim_synthesis/15346/post.html. [Accessed 9 October 2017].
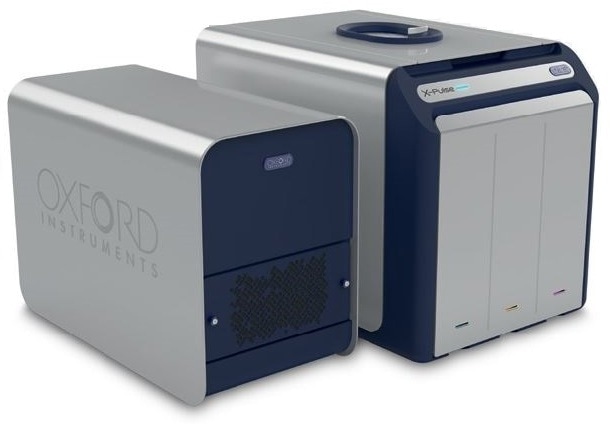
This substance is utilized as an example to demonstrate the performance of the 60 MHz NMR spectrometer (shown in Figure 1), and also the variation between the two-dimensional (2D) experiments - COSY-45 and COSY-90.
Method
This article shows a comparison of both these experiments at 60 MHz (Figures 3 and 4), and comprehensive data treatment with Mestrelab’s Mnova software - a complete range of sophisticated routines for data processing and analysis.
As shown in Figure 1, the 1D 1H NMR spectra are usually performed since they offer rich quantitative and qualitative data about the setting of atoms in molecules. This information can be used to detect and define reactions and compounds. COSY is a 2D NMR experiment that offers more information about the connectivity between atoms, allowing structural elucidation.
Basic 1 and 2D NMR Experiments
Compared to high-field superconducting instruments, benchtop NMR spectrometers have lower resolution and sensitivity; signals are usually broader, and overlap can make it difficult to understand where spectra are packed.
Three basic pulse sequences are shown in Figure 2, demonstrating what exactly takes place in a spectrometer at the time of experimental acquisition. Each pulse sequence starts with an equilibration/relaxation delay (RD), wherein spins align with the external magnetic field.

Figure 2. The onepulse, COSY-90, and COSY-45 NMR pulse sequences.
A perpendicular radiofrequency (RF) pulse is applied for a few microseconds in the onepulse experiment. This causes the bulk magnetization to tilt into the transverse plane. This subsequently relaxes back to equilibrium (the Free Induction Decay, or FID in short), and can be spotted as it induces current in the receiver electronics.
When the FID is mathematically treated with a Fourier Transform (FT), the time domain signal is converted into a frequency-domain signal - the NMR spectrum. This NMR spectrum reveals data about the different chemical environments of atoms (often protons) in the sample.
Two 90° pulses isolated by a delay (t1) are used by the standard COSY-90 experiment. The pulse sequence is again performed with a range of incremented delays. Furthermore, Fourier Transform in both dimensions enables the J-coupling between the adjacent protons to be shown as off-diagonal crosspeaks.
Results
The COSY-45 sequence is similar to the COSY-90, except that the second RF pulse has 50% of the duration. Following 2D Fourier Transform, the ensuing spectrum has a reduced diagonal signal, at a price to the signal-to-noise ratio. But the decreased diagonal signals make it easier to distinguish close resonances as illustrated in Figure 4.
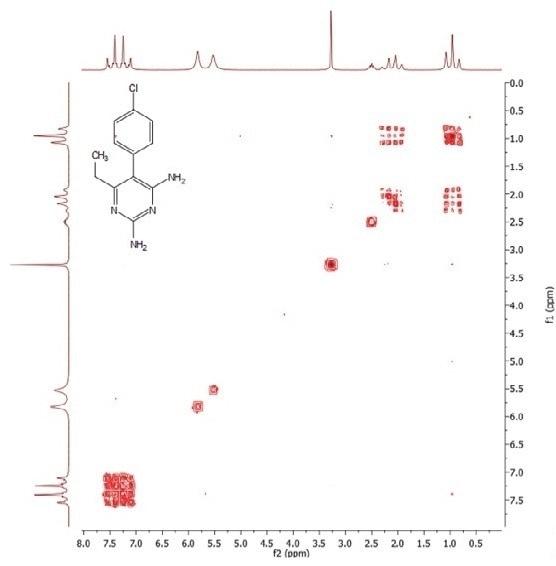
Figure 3. 1H COSY-90 spectrum of pyrimethamine. Four scans, 128 increments, approximately 17 minutes’ acquisition.
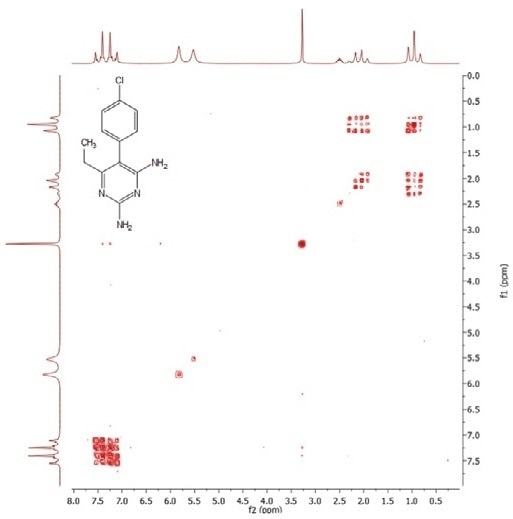
Figure 4. 1H COSY-45 NMR spectrum of pyrimethamine. Four scans, approximately 17 minutes’ acquisition.
The aromatic doublet of doublets crosspeaks at about 7.6 ppm can be observed more vividly in the COSY-45 spectrum following diagonal suppression, specifically with the wavelets and convolution method.
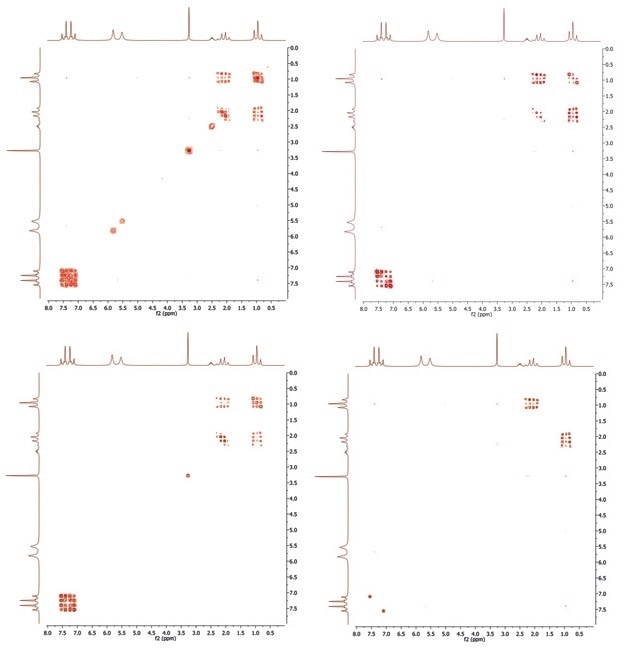
Figure 5. COSY-90 (top left), with convolution diagonal suppression (top right), shifted convolution (bottom left), and wavelets (bottom right).
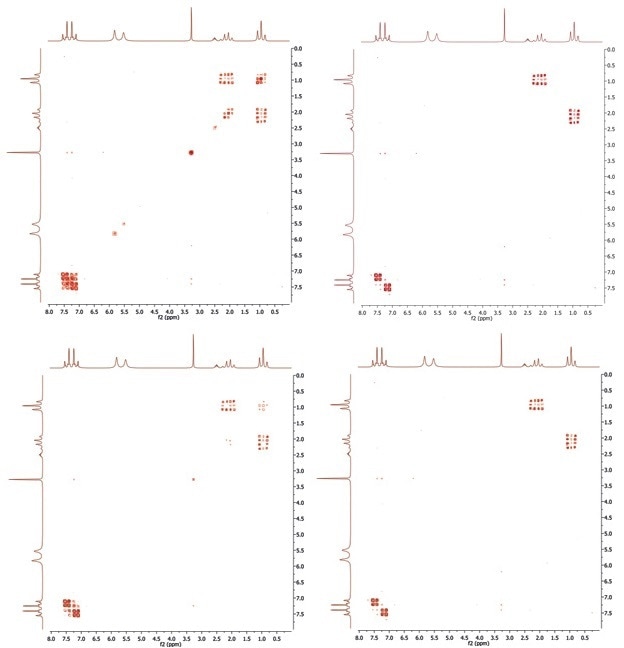
Figure 6. COSY-45 (top left), with convolution diagonal suppression (top right), shifted convolution (bottom left), and wavelets (bottom right).
Conclusion
Numerous NMR pulse sequences create varied results, which can considerably help with the interpretation or structural assignment. COSY-45 and COSY-90 are among the most simple 2D NMR experiments, offering rich data that can be further manipulated with Mnova’s sophisticated data processing tools.

This information has been sourced, reviewed and adapted from materials provided by Oxford Instruments Magnetic Resonance.
For more information on this source, please visit Oxford Instruments Magnetic Resonance.