There are two important physical properties of electrode materials. The first is tapped density, which impacts the energy density of a Li-ion battery (LIB). The other is the particle size distribution. This property provides the necessary information for optimizing the grinding parameters during production.
High-energy-density during LIB manufacture can also be improved by improving the tapped density. It is, therefore, necessary for the LIB producer to determine the most optimal and achievable tapped density and use this parameter as the “gold standard” measure samples from the production process until the producer can either match or approximate the “gold standard” measurement.
The BeDensi T Pro series is an ideal tapped density tester. As an economical device, it delivers an incomparable performance with no compromises.
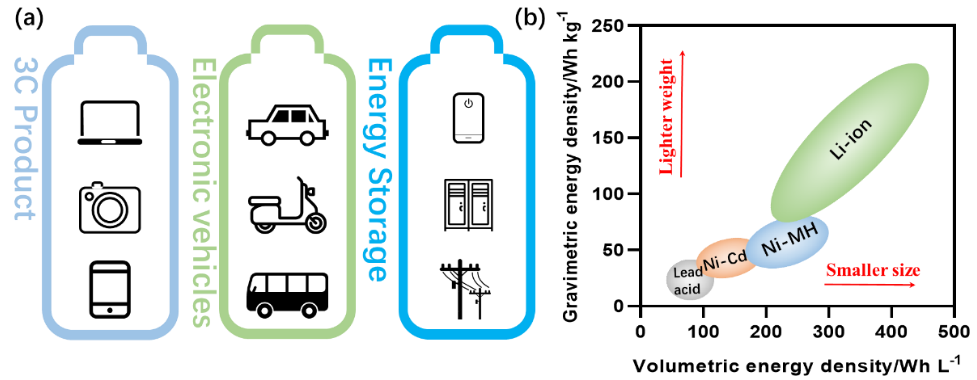
Li-ion battery (LIB) is used widely in 3C products (Computer, Communication and Consumer Electronics), also known as Information Appliances. As 3C products are often small, they may also be referred to as “3C small appliances”. Figure 1a displays other devices using LIB, including stationary energy storage systems and electronic vehicles.
Out of all other choices, LIB is preferable because it has the highest energy density of practical rechargeable batteries (as shown in Figure 1b). The volumetric energy density of a battery is a necessary parameter to consider because of these volume-constrained applications.

Figure 1. Applications of Li-ion battery (a) and energy density of rechargeable batteries (b). Image Credit: Bettersize Instruments Ltd.
The amount of energy stored per unit volume is termed the volumetric energy density and is typically expressed in Watt-hours per liter (Wh/L).
Typically, a Li-ion battery with a higher volumetric energy density holds more energy than a similar battery with a lower energy density. In addition, there is often a size limitation when installing the LIB into the appropriate product, so a smaller size higher-energy-density LIB is a notable advantage in volume-constrained systems.
The achieved energy storage capability is still not adequate to meet the growing markets demand, despite the fact that extensive studies have been performed to increase the energy density and power in LIBs.1
The active materials in the LIB cathode electrode must have a high tapped density to achieve a high volumetric energy density. Table 1 depicts the disparity between theoretical and the tapped densities of active materials (including LiCoO2 (LCO), Li (NixCoyMnz)O2 (NCM), LiFePO4 (LFP) and LiMn2O4) in a typical cathode.
Table 1. Theoretical and tapped density of cathode materials. Source: Bettersize Instruments Ltd.
| Cathode Materials |
Li (NixCoyMnz)O2 |
LiFePO4 |
LiMn2O4 |
LiCoO2 |
| Theoretical density (g/cm3) |
4.85 |
3.60 |
4.31 |
5.10 |
| Tapped density (g/cm3) |
2.6-2.8 |
0.80-1.10 |
2.20-2.40 |
2.80-3.00 |
Typically, tapped density is closely related to particle size, particle size distribution, morphology, and so on.2 Optimizing the production process is expected to improve density. It is possible to specifically optimize several parameters, including precursor preparation, calcination and grinding.
Roll pressing follows on from the mixing of cathode active materials with a binder or conductive agent and subsequent coating on an Aluminum collector. To hold more energy with the same volume, the packaging density of electrodes will be improved.
The particle size distribution (PSD) of the cathode powder materials is directly influenced by the grinding time. The PSD has a significant influence on the tapped density. This project’s primary goal was to explore the effect of this relationship of the PSD on the tapped density of LIB cathode materials.
Experimental
The BeDensi T2 was used to characterize the tapped densities of two LiFePO4 (LFP) samples prepared under different grind times with two workstations. In accordance with ASTM B527-20, the experiments were tested, and a 50 g sample was used to pour into the cylinder.3
The tapping speed was 200 taps/minute, the drop height used was 3 mm and the total tapping time lasted 8 minutes. Using the Bettersizer ST, the particle size distribution of the samples was measured in under a minute by laser diffraction.
Results
Tapped Density
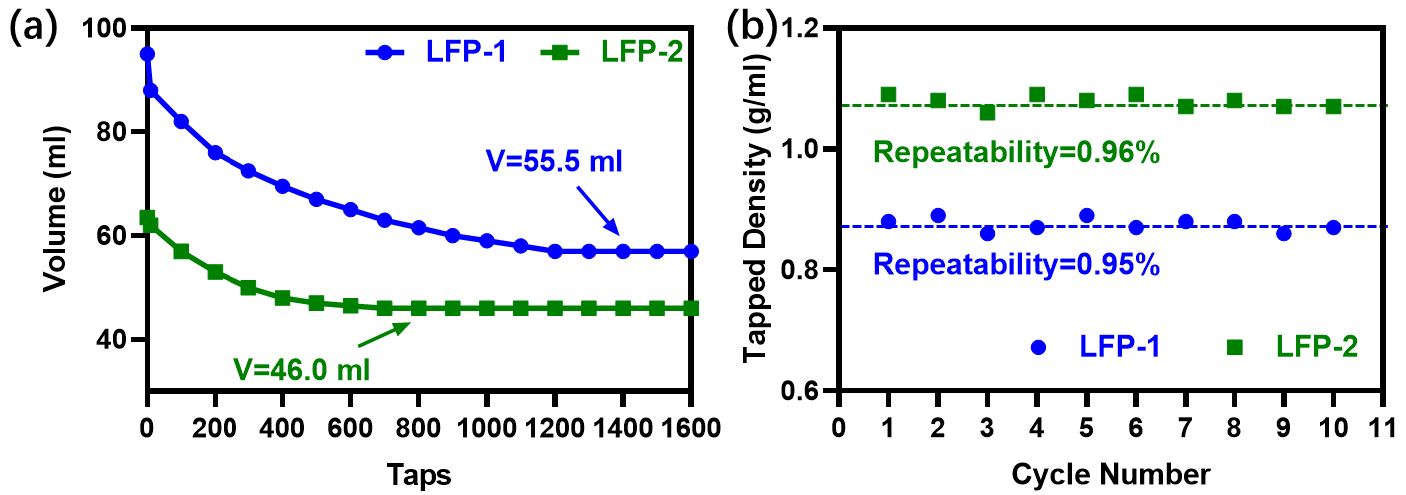
Figure 2a displays that the tapped volume of LFP-1 and LFP-2 powders is 55.5 ml and 46.0 ml, respectively. The instrument’s calculation reports confirm that the tapped density for LFP-1 was 0.89 (g/cm3) for LFP-2 was 1.08 (g/cm3). For each sample, 10 replicates were reported in Figure 2b, which confirms that the results of each test were capable of being repeated.

Figure 2. (a) sample volume changes during tapping, (b) 10 repeat sample measurements of tapped density. Image Credit: Bettersize Instruments Ltd.
The accurate and repeatable results are primarily a result of three principal reasons:
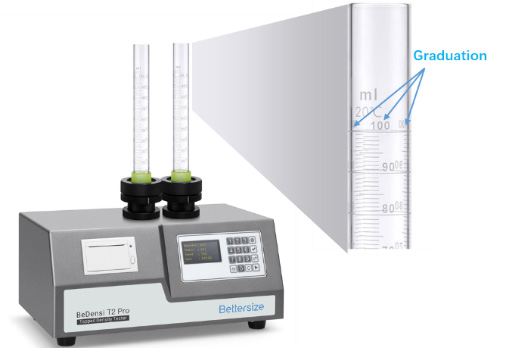
The first of these is that the test method meets the ASTM B527-20 standard. The second reason is that the tester has a device that spins the cylinder to reduce and minimize any possible separation of the mass during the tapping process. Finally, the cylinders are graduated and interpreted from three different angles, as displayed in Figure 3.
Following this stage, an average value is calculated by obtaining a mean value from all three readings, which is then used to calculate the tapped density.

Figure 3. The BeDensi T2 Pro with the easy-to-read graduated cylinders. Image Credit: Bettersize Instruments Ltd.
Table 2. Theoretical and tapped density of cathode materials. Source: Bettersize Instruments Ltd.
| Sample |
Dmin (μm) |
D10 (μm) |
D50 (μm) |
D90 (μm) |
Dmax (μm) |
| LFP-1 |
0.28 |
1.10 |
4.08 |
12.21 |
38.41 |
| LFP-2 |
0.28 |
1.46 |
9.21 |
18.07 |
38.41 |
Particle Size Distribution (PSD)
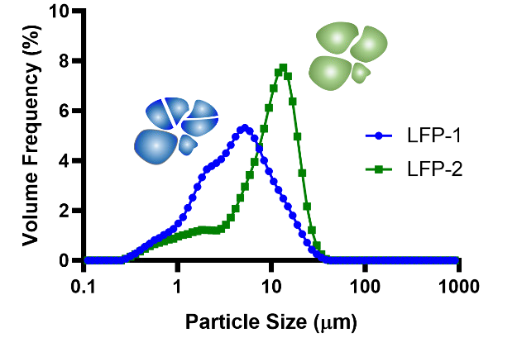
The particle size distributions (PSD) of the two LFP were studied after the tapped density measurements. Figure 4 displays the results, which reveal that PSDs of both samples have the same range of 0.28 to 38.41 μm, whilst the D50 for LFP-2 is 9.21 μm, compared to 4.08 μm for LFP-1.

Figure 4. The PSD of two samples ranging from 0.28 to 38.41SampleDmin. Image Credit: Bettersize Instruments Ltd.
It is, therefore, important to note that both samples have the same PSD range, while the D50 of LFP-1 is smaller than LFP-2, leading to a lower tapped density.
It was reported by Ying et al. that there is a correlation between particle size and tap-density: the smaller the average particle size, the lower the tap-density is.4 In this case, as LFP-1 in Figure 4 illustrates, increasing the grinding time will reduce the particle size.
This size reduction leads to a decrease in density occupying a larger volume in these samples. The tapped density tester and laser diffraction analyzer are necessary for those wishing to understand the relationship between tapped density and PSD, optimize the production process and manufacture high-quality LIBs.
Conclusion
The BeDensi T Pro Series display reports confirm that the optimal tapped density has been attained by tuning particle size distribution.
Tapped density, as one of the most important properties of cathode electrode material, should be improved during the preparation process. This allows the Li-ion battery to hold more energy within the same volume of material.
It is, therefore, imperative for a manufacturer of LIB to employ a highly efficient and easy-to-use tapped density tester in order to rapidly characterize the tapped density of the electrode materials.
When it comes to measuring electrode materials for research, development stages testing and production control, the BeDensi T Pro Series is ideal for application use.
References
- El Kharbachi, A., et al. Exploits, advances and challenges benefiting beyond Li-ion battery technologies. J. Alloys Compd., 817 (2020)
- Yang, S., et al. High Tap Density Spherical Li[Ni0.5Mn0.3Co0.2]O2 Cathode Material Synthesized via Continuous Hydroxide Coprecipitation Method for Advanced Lithium-Ion Batteries. Int. J. Electrochem., 9 (2012).
- ASTEM B527-20 Standard: Test Method for Tap Density of Metal Powders and Compounds.
- Ying J, et al. Preparation and characterization of high-density spherical LiNi0.8Co0.2O2 cathode material for lithium secondary batteries. J. Power Sources, 99 (2001)

This information has been sourced, reviewed and adapted from materials provided by Bettersize Instruments Ltd.
For more information on this source, please visit Bettersize Instruments Ltd.
