Nano alumina is a material that is heavily relied upon in the process of high-precision material polishing; a list that includes the following: crystal surfaces, glass products, gemstones, optical lenses, microcrystalline glass substrates, semiconductors, plastics, crystal surfaces, and more.

Image Credit: Bettersize Instruments Ltd.
When it comes to preventing the formation of alumina aggregates that may lead to scratches on workpieces, the stability of polishing suspension is significant.
Zeta potential, a key indicator, must be accurately determined in order to evaluate the polishing suspension’s stability. The size and zeta potential of nano alumina dispersed in the aqueous environment were characterized by the BeNano 90 Zeta in this process.
Instrumentation
Equipped with a solid-state laser with a wavelength of 671 nm and a power of 50 mW, the BeNano 90 Zeta nanoparticle size and zeta potential analyzer is ideal for characterizing the size and zeta potential of nano alumina. In order to facilitate DLS measurement, the scattered light signals of the sample at 90° were obtained and collected.
The correlation function was provided by the calculation of the intensity fluctuation. As a result, the diffusion coefficient could then be obtained. The size and size distribution of the sample was determined using the Stokes-Einstein equation.
The phase analysis light scattering (PALS) technique was used to provide the electrophoretic mobility from the scattered signals at 12, with which the zeta potential of the sample can be derived from the Henry equation.
Sample Preparation
The nano alumina slurry, a highly concentrated slurry, was subsequently diluted in deionized water by 100 times. Using the built-in temperature control unit in the BeNano 90 Zeta, the measurement temperature was maintained at 25 °C.
The DLS measurement was facilitated by the polystyrene (PS) cell, whereas zeta potential measurement was obtained by use of the folded capillary cell. In order to investigate the repeatability of results and obtain standard deviations, each sample was measured at least three times.
Results and Discussion
a) Size Measurement

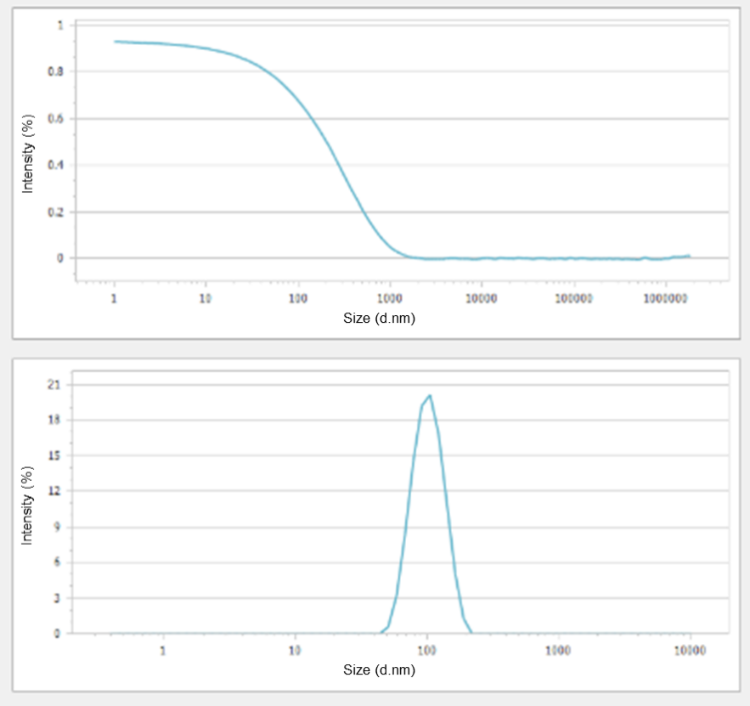
Figure 1. Correlation function (top) and size distribution (bottom) of a nano alumina. Image Credit: Bettersize Instruments Ltd.
Using the DLS technique, the size and size distribution of the nano aluminum oxide were measured. The Z-average diameter is 100.91 nm and the polydispersity index (PDI) is 0.034. The size distribution showed a single peak, with PDI being smaller than 0.05, indicating that the nano aluminum oxide is close to monodisperse in size.
b) Zeta Potential Measurement

Figure 2. Phase plot (left) and trend plot of zeta potential (right). Image Credit: Bettersize Instruments Ltd.
The zeta potential of nano alumina was detected by the use of the PALS technique. The phase plot of the zeta potential measurement is depicted in Figure 2, the slope of which indicates the light frequency shift due to electrophoresis. The high signal-to-noise ratio is demonstrated by the steep slope.
Table 1 depicts the values of zeta potential that resulted from 10 measurements. As suggested by Table 1, it appears that the particle surfaces are carrying a negative charge, as the zeta potential values of nano aluminum oxide in water were negative. Good result repeatability is shown by the mean value of zeta potential, at 37.3 mV, and the standard deviation at 0.92 mV.
The high stability of the suspension is suggested by the amplitude of the zeta potential being over 30 mV. Moreover, the PDI being 0.034 further proves this stability with the lack of aggregates.
Conclusions
Successful employment of the BeNano 90 Zeta in this process allowed the determination of the size and zeta potential of nano alumina dispersed in the aqueous environment. It is suggested by the measurement results that the nano alumina is close to monodisperse in size and has high stability with the zeta potential amplitude over 30 mV.
Table 1. Zeta potentials of nano alumina. Source: Bettersize Instruments Ltd.
| Test |
Zeta Potential (mV) |
| 1 |
-37.0 |
| 2 |
-37.9 |
| 3 |
-36.6 |
| 4 |
-38.6 |
| 5 |
-37.8 |
| 6 |
-37.2 |
| 7 |
-35.6 |
| 8 |
-36.4 |
| 9 |
-38.1 |
| 10 |
-37.9 |
| Mean |
-37.3 |
| Standard Deviation |
0.92 |

This information has been sourced, reviewed and adapted from materials provided by Bettersize Instruments Ltd.
For more information on this source, please visit Bettersize Instruments Ltd.
