A focused ion beam scanning electron microscope (FIB-SEM) featuring a compact Time-of-Flight Secondary Ion Mass Spectrometer (ToF-SIMS) and a traditional microanalytical method of Energy Dispersive X-Ray Spectrometry (EDS) offers new characterization options when it comes to Li-ion Battery components.1-4
All the analytical information obtainable by SEM, EDS, or ToF-SIMS is specific and provides different information (Figure 1). For example, the SEM imaging signal can describe topography and component structure with high spatial resolution, but it is unable to provide information regarding chemical composition.
While the EDS provides element identification, it is not well suited for the detection of X-Rays from the lightest elements, including lithium.5 Its spatial resolution is also limited by the electron beam interaction volume. The ToF-SIMS method provides more thorough information regarding the chemical state of a material due to its isotopic, elemental, and molecule fragment detection abilities. Unlike EDS, ToF-SIMS is highly sensitive to lithium, making it a particularly useful method for current energy storage technologies development.
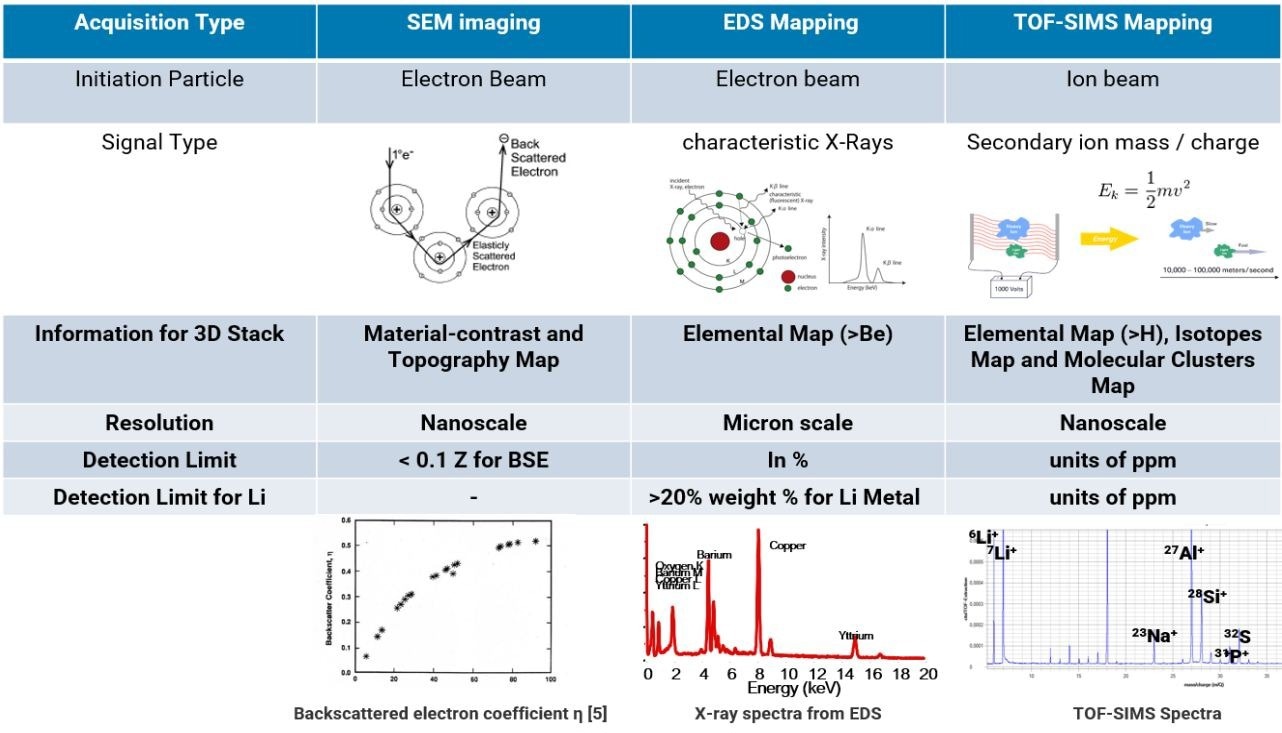
Figure 1. Comparison of analytical techniques and information available in FIB-SEM instrument. Image Credit: Tescan USA Inc.
Serial-Sectioning FIB-SEM Tomography
Various materials are studied using a 2D approach based on the cross-section or surface analysis. This 2D characterization can only answer simple compositional properties of the analyzed material and is unable to provide comprehensive information from the statistical viewpoint. For instance, the association between chemical contamination and defects during the life of the battery. 3D information enables the localization of chemical information connected to volumetric objects, such as defects, particles, pores, and more.
The simple volume analysis in FIB-SEM is based on FIB serial-sectioning and SEM imaging with topographical and material contrast data collection capability (Figure 2). Simultaneous EDS and/or EBSD mapping is more frequently required, offering qualitative information on elemental distribution. However, the complete 3D analytical potential had not been previously reported.
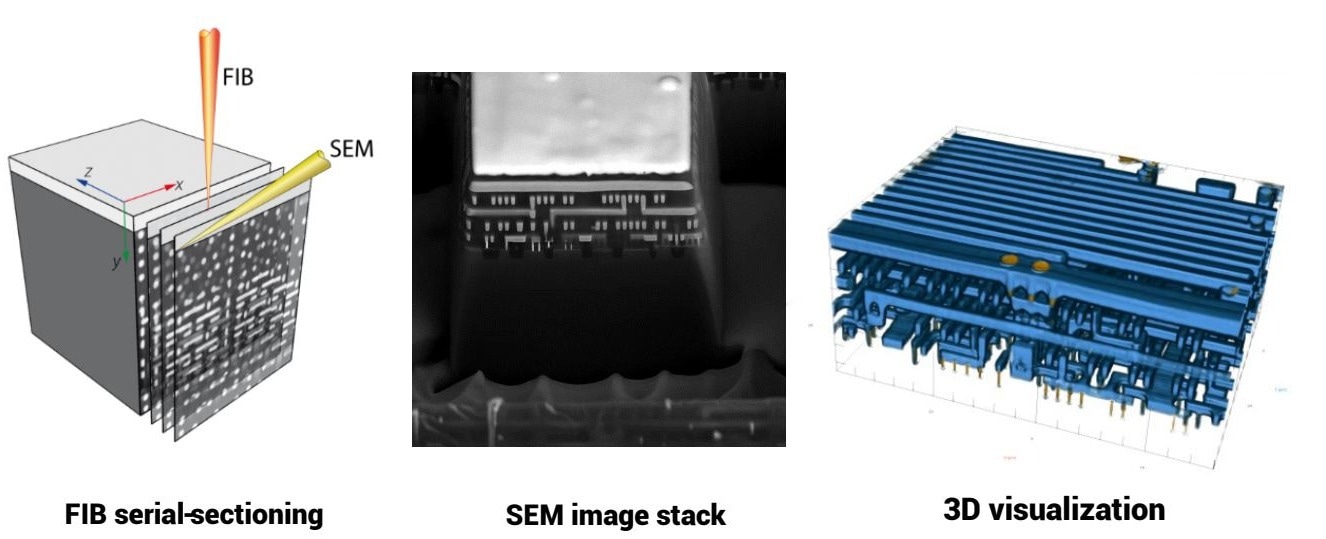
Figure 2. Schematic image of FIB-serial sectioning tomography workflow and 3D volume visualization using SEM images. Image Credit : Tescan USA Inc.
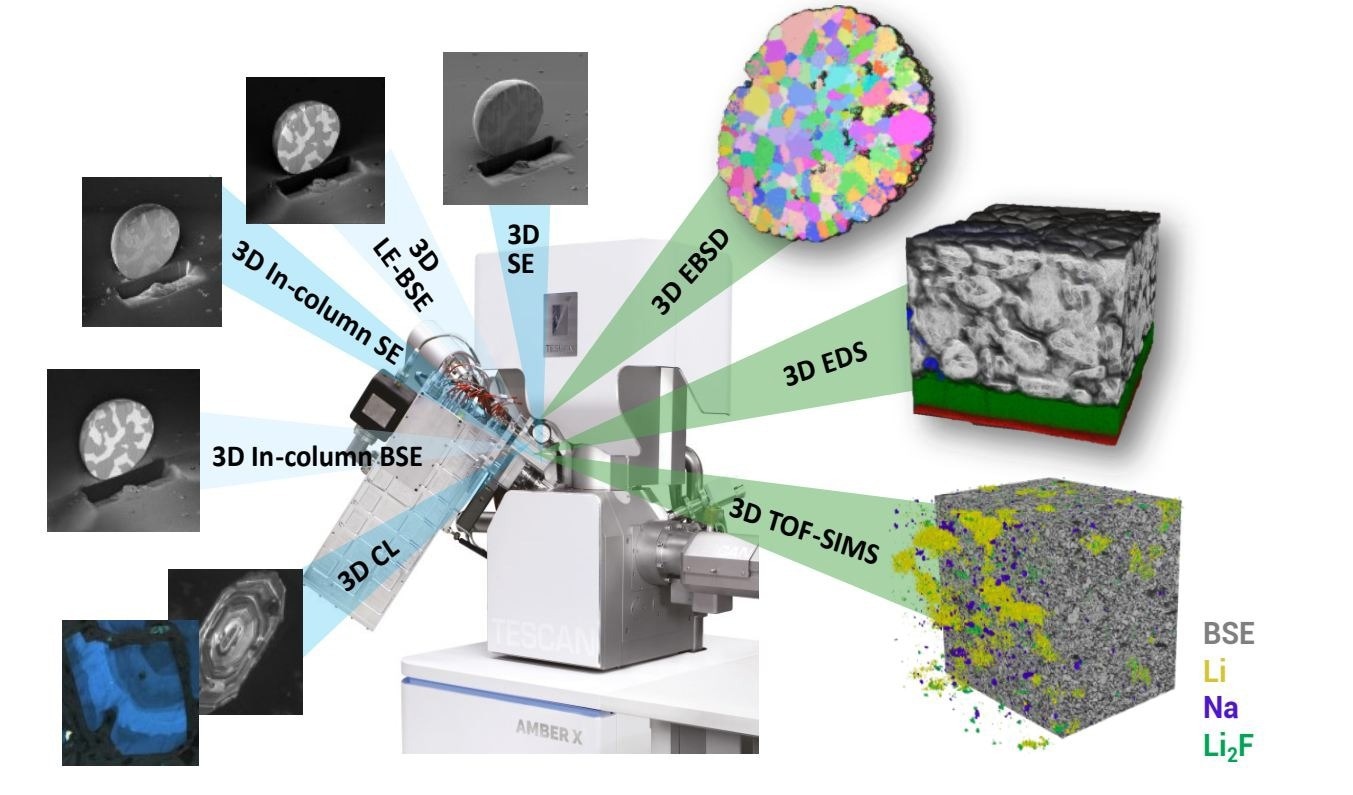
Figure 3. 3D analytical potential of TESCAN AMBER X FIB-SEM system. Image Credit: Tescan USA Inc.
3D ToF-SIMS Serial Sectioning and Visualization
Unlike traditional ToF-SIMS analysis, 3D FIB-SEM tomography-based ToF-SIMS allows parametrical 3D visualization of Li and other elements and molecules. It also provides more accurate chemical and morphology data with a substantially reduced effect of uneven local differences in the milling rate of heterogeneous battery materials. This takes advantage of methods like silicon masking and sample rocking to optimize cross-section quality.
The integration of ToF-SIMS measurement into the serial-sectioning workflow (Figure 4) happens through manipulator movement, which moves the cross-section plane perpendicular to the FIB. This allows for ToF-SIMS data collection without the effects of image deformation or shading. This method has been previously reported but in the context of a dedicated ToF-SIMS instrument with an extra orthogonal FIB column.6
Throughout the acquisition, both EDS and ToF-SIMS data are stored with complete spectral information. TESCAN has developed a dedicated module for converting spectra into 3D peak intensity maps for visualization (Figure 5).7
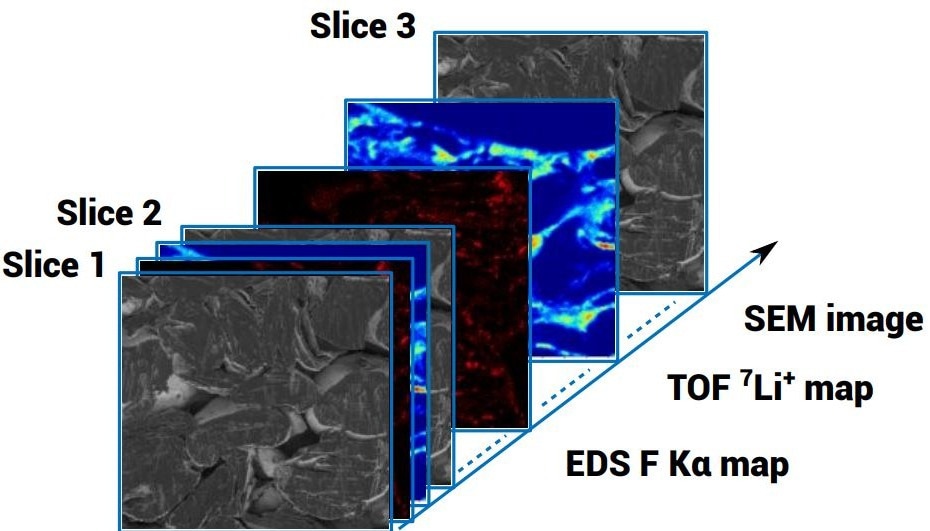
Figure 4. Schematic image of serial sectioning workflow with illustration of sequentialy acquired volume multispectral and multi-analytical data. Image Credit: Tescan USA Inc.
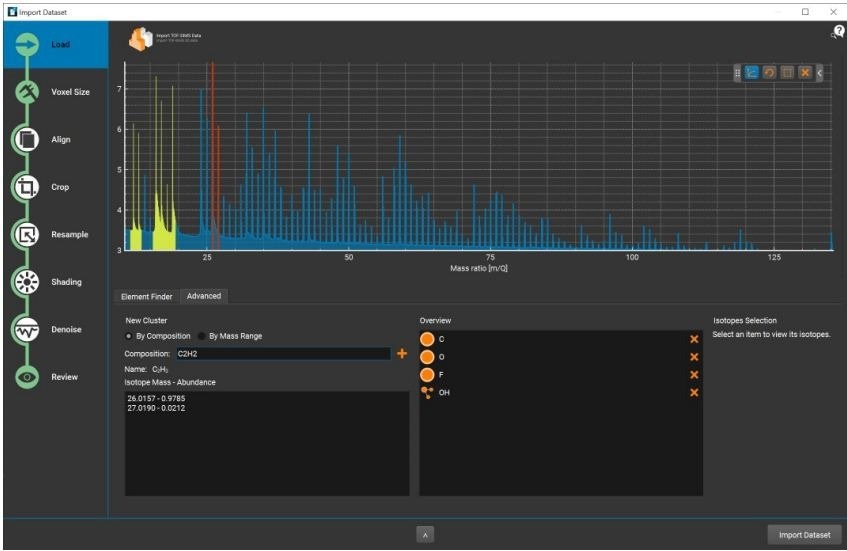
Figure 5. 3D ToF-SIMS spectral data preprocessing for 3D visualization. Image Credit: Tescan USA Inc.
3D Multi-Modal Characterization of Li-Ion Battery Components
Using this method on an inertly transferred cycled LFP cathode (Figure 6), all possible information can be gathered to help with understanding inner properties. This includes porosity, delamination, electrode particle degradation, cracking, and chemical contamination. This information enables example evaluation of battery material degradation along with its base causes, such as mechanical damage, Li dendrite growth, or parasitical chemical reaction.
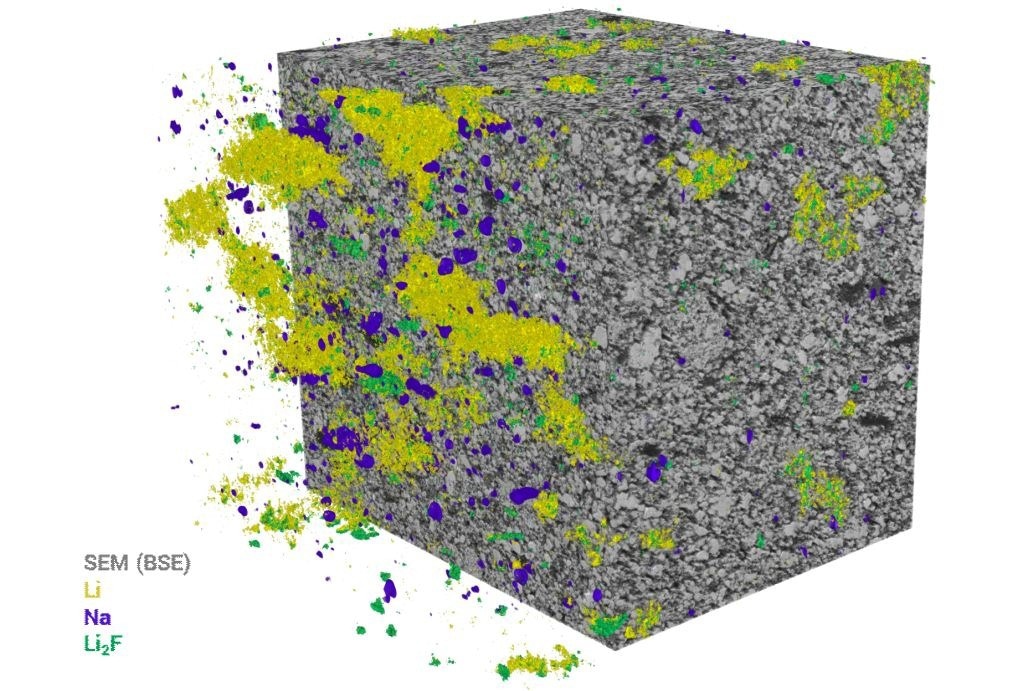
Figure 6. 3D ToF-SIMS data visualization of a cycled LFP cathode overlayed with 3D SEM-BSE imaging dataset. Shown volume has size of 60 x 60 x 60 um3. Image Credit: Tescan USA Inc.
References and Further Reading
- J.A. Whitby et al., Advances in Materials Science and Engineering [Online] 2012, 180437 (2012). https://doi.org/ 10.1155/2012/180437. (02.21.2023)
- D. Alberts et al., Instrumentation Science & Technology 42,4, (2014), p. 432-445. doi:10.1080/10739149.2013.878843.
- T. Sui et. al., Nano Energy 17 (2015), p. 254-260. https://doi.org/10.1016/j.nanoen.2015.08.013.
- Bessette S. et al., Scientific Reports [Online] 8, 17575 (2018), https://doi.org/10.1038/s41598-018-33608-3 (07.01.2023)
- Hovington, P. et al., Scanning 38 (2016), p. 571–578. https://doi.org/10.1002/sca.21302
- Szakal, Christopher et al., Analytical chemistry 83,4 (2011), p. 1207-1213. doi:10.1021/ac1030607
- TESCAN 3D Analysis Suite, https://www.tescan3dim.com/solutions/software-for-3d-microscopy/3d-visualization (07.01.2023)

This information has been sourced, reviewed and adapted from materials provided by TESCAN GROUP.
For more information on this source, please visit TESCAN GROUP.