The increasing need for improved, safer, and more dependable batteries calls for the development of workflows that can effectively analyze batteries and battery materials at different stages of their development.
The battery value chain (BVC) can be viewed as a series of domains and processes, with each step having a set of specific needs for imaging and analysis. This chain spans from sourcing raw materials to creating innovative electrode types utilized in single cells, larger modules, or complex devices. Extensive research and development are essential to investigate every phase of this chain.
TESCAN has concentrated on creating innovative analysis methods tailored to each step of the BVC, as shown in Figure 1. By linking key features of interest, TESCAN aims to provide a comprehensive understanding of each stage.
This contribution emphasizes non-destructive analysis using micro-CT and showcases how resolution and analytical capabilities can be enhanced with FIB-SEM.
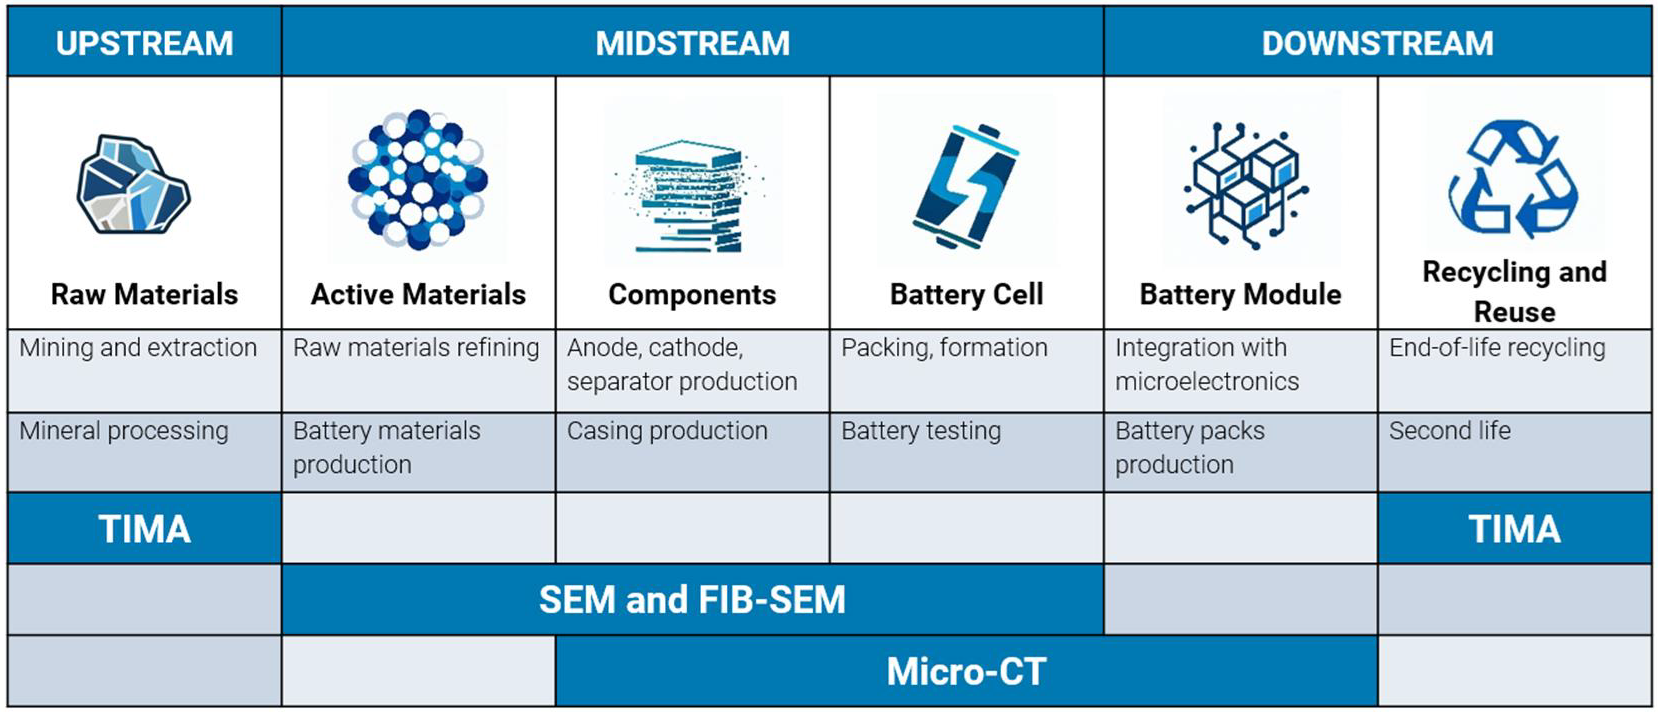
Figure 1. The battery value chain shows different stages of battery development and the analytical techniques that serve their characterization. Image Credit: TESCAN Group
Characterization of Li-Ion Batteries Using Non-Destructive Micro-CT Analysis
As displayed in Figures 1 and 2, micro-CT characterization supports a broad range of sample sizes and shapes and, as a result, can be utilized in multiple stages in the BVC. Samples can be analyzed from the component level (i.e., the electrodes, separators, casings, etc.) up to the full module level using this method, including modules that are comprised of several cells and their connecting electronics.
The non-destructive nature of micro-CT allows for multi-scale analysis, beginning with rapid overview scans of entire modules and cells. This technique then zooms into smaller areas of interest without physically disturbing the integrity of the battery.
Typically, micro-CT generates 3D volumes with a spatial resolution that varies from several tens of micrometers to a few hundred nanometers, depending on the sample size and specific analytical needs.
For analyzing cells and modules, essential requirements include fast scan speeds and high throughput to ensure effective quality control across numerous samples. In the analysis of components, particularly in research and development settings, factors like resolution and image quality often take precedence over scan speed.

Figure 2. Typical range of sample sizes and shapes that can be served with micro-CT systems. Image Credit: TESCAN Group
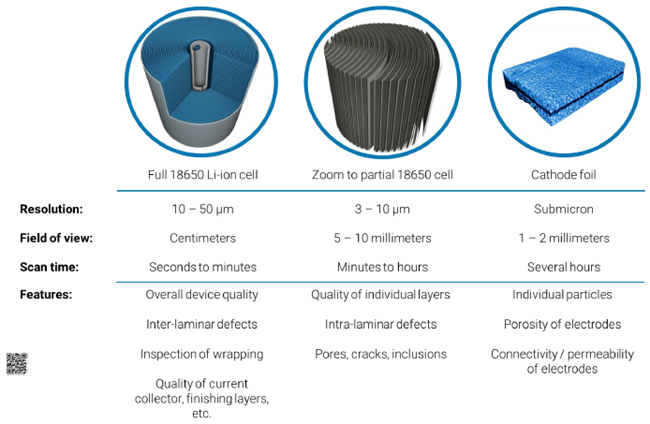
Figure 3. Impression of scan times, sample size, achievable resolution and typical analysis for different battery components. Image Credit: TESCAN Group
Example: Analysis of Anode Overhang
Battery electrode assemblies are comprised of anode and cathode sheets, where anode sheets are generally larger than cathode electrodes. The spatial gap between the larger anodes and the smaller cathodes is categorized as the anode overhang (AO).
This overhang has a major influence on battery performance, meaning precision alignment is vital when it comes to the optimization of cell efficiency. This anode overhang can also have a considerable impact on battery efficiency and cycle life.
Ensuring electrode assemblies are meticulously aligned with consistent AO is crucial for maintaining efficient charge and discharge cycles. If certain tolerances are exceeded, the cells can pose a safety risk due to the frequently flammable electrolyte; a sudden, unexpected discharge may trigger thermal runaway.
Leveraging the power of micro-CT not only enables the visualization of the overhang but also allows for its quantification across various structural parameters such as length, curvature, and the exit angle from the cathode. Furthermore, this technique facilitates the analysis of the spatial distribution of these parameters.
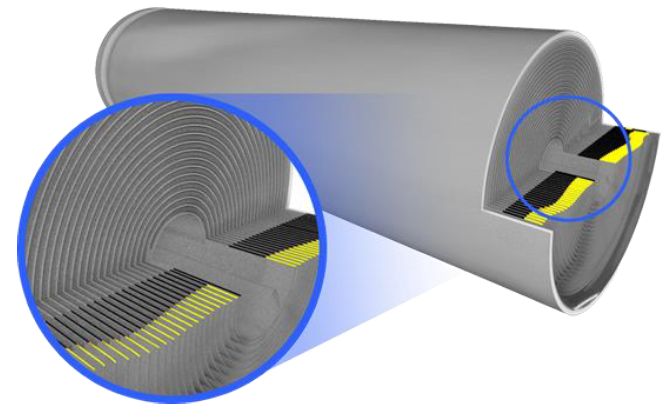
Figure 4. Segmentation of the anode overhang in a micro-CT scan of a cylindrical 18650 Li-ion battery. Image Credit: TESCAN Group
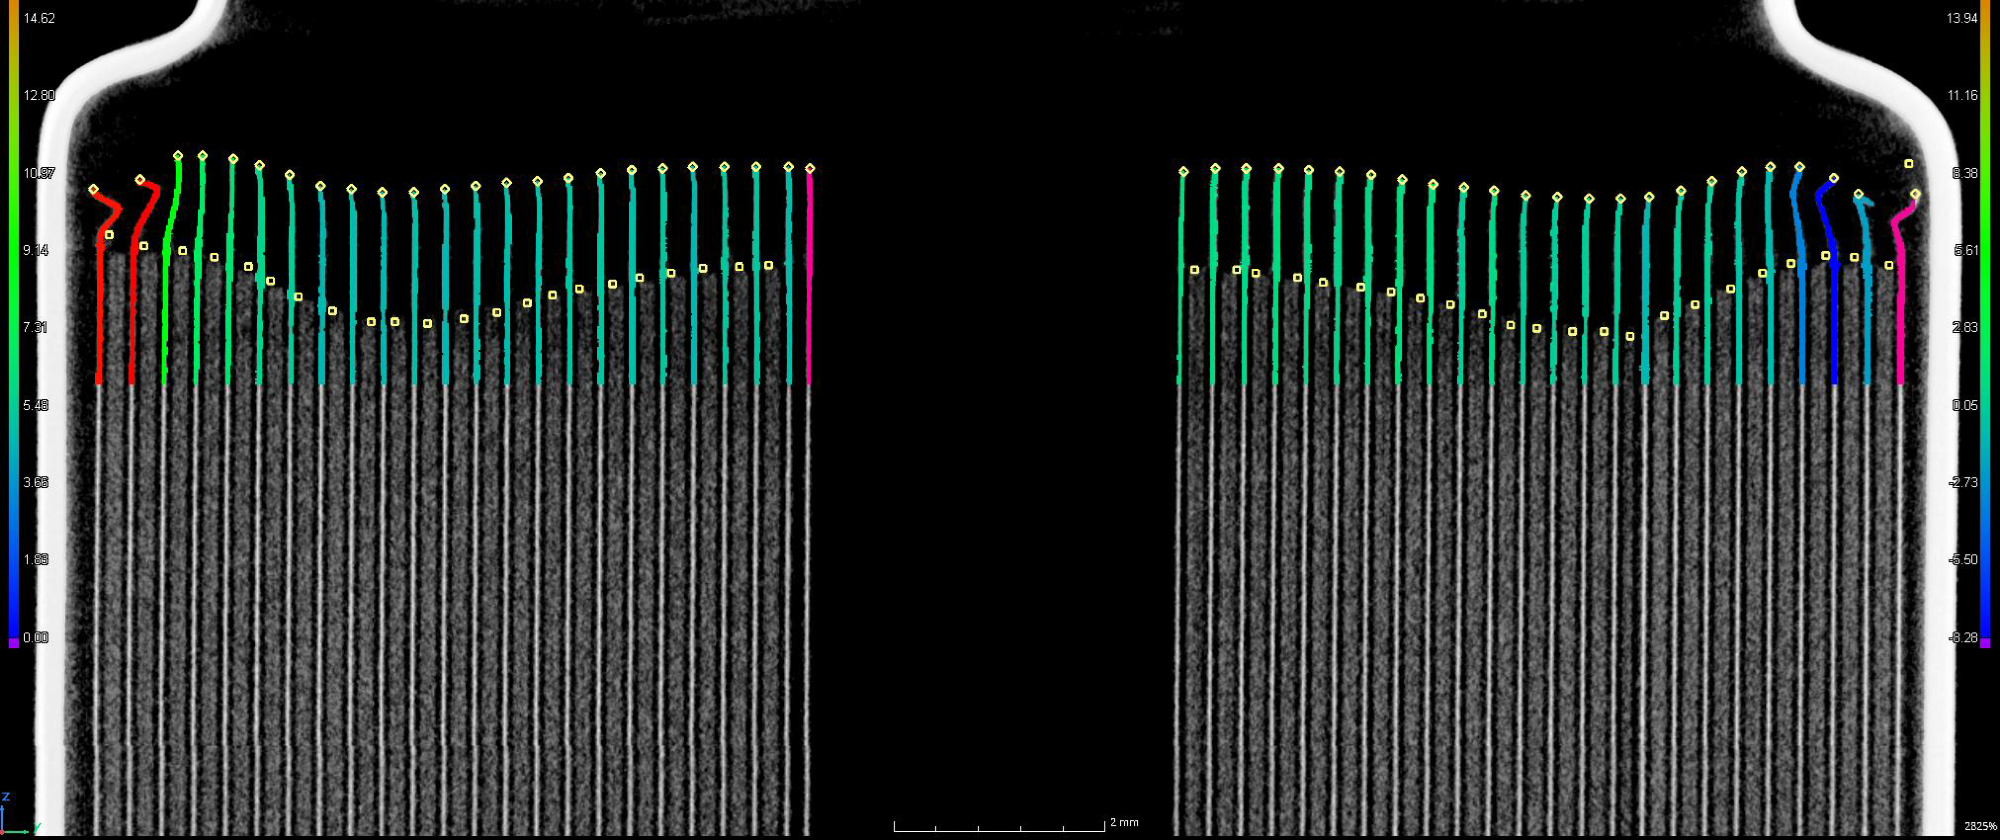
Figure 5. Color coding of the overhang according to curvature. Image Credit: TESCAN Group
Increasing Resolution Capabilities Using Plasma FIB-SEM
Micro-CT is an exceptional analytical method for examining samples ranging from millimeters to centimeters down to sub-micron resolution. However, to fully understand battery components and their particles, higher resolution is needed.
Nonetheless, 3D analysis remains crucial as parameters such as porosity and permeability significantly influence battery performance and durability. Given that particles are only a few micrometers in size, analyzing a relatively large volume is essential, achievable only through plasma FIB-SEM.
Employing the same 3D analytical algorithms used in micro-CT, segmentation of active particles, binders, electrolytes, separators, etc., can be performed at nanometer resolution in representative volumes.
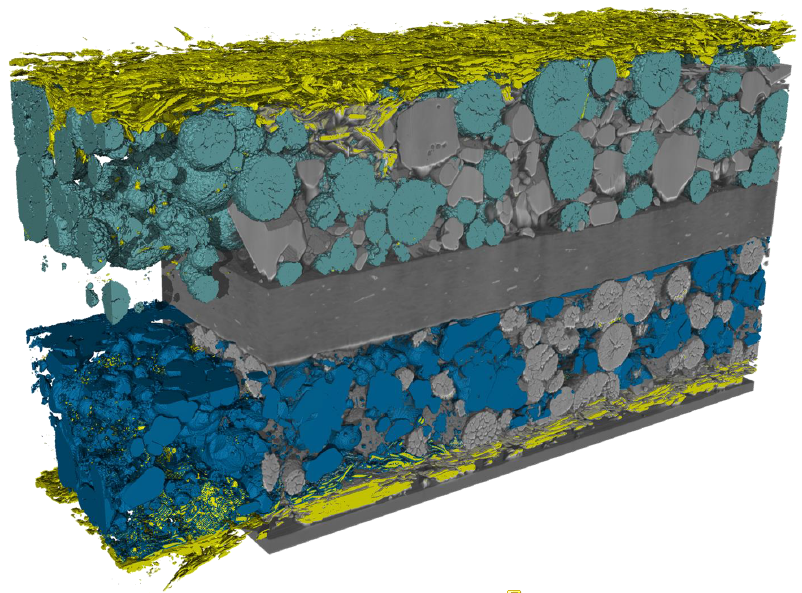
Figure 6. Segmentation of different particle types in a 100 x 100 x 50 µm3 volume of a Li-ion battery cathode, acquired using the TESCAN AMBER X. Image Credit: TESCAN Group
Unique Analytical Capabilities
Combining FIB-SEM with other analytical techniques offers unique insights into both the structure and chemistry of batteries. Time-of-flight secondary ion mass spectrometry (ToF-SIMS) stands out as one of the few methods capable of detecting the light element lithium.
Understanding the distribution and potential trapping of lithium is crucial for advancing the development of new batteries. By integrating 3D FIB-SEM Tomography with ToF-SIMS, a high-resolution 3D distribution of lithium within the electrodes of solid-state batteries can be achieved.
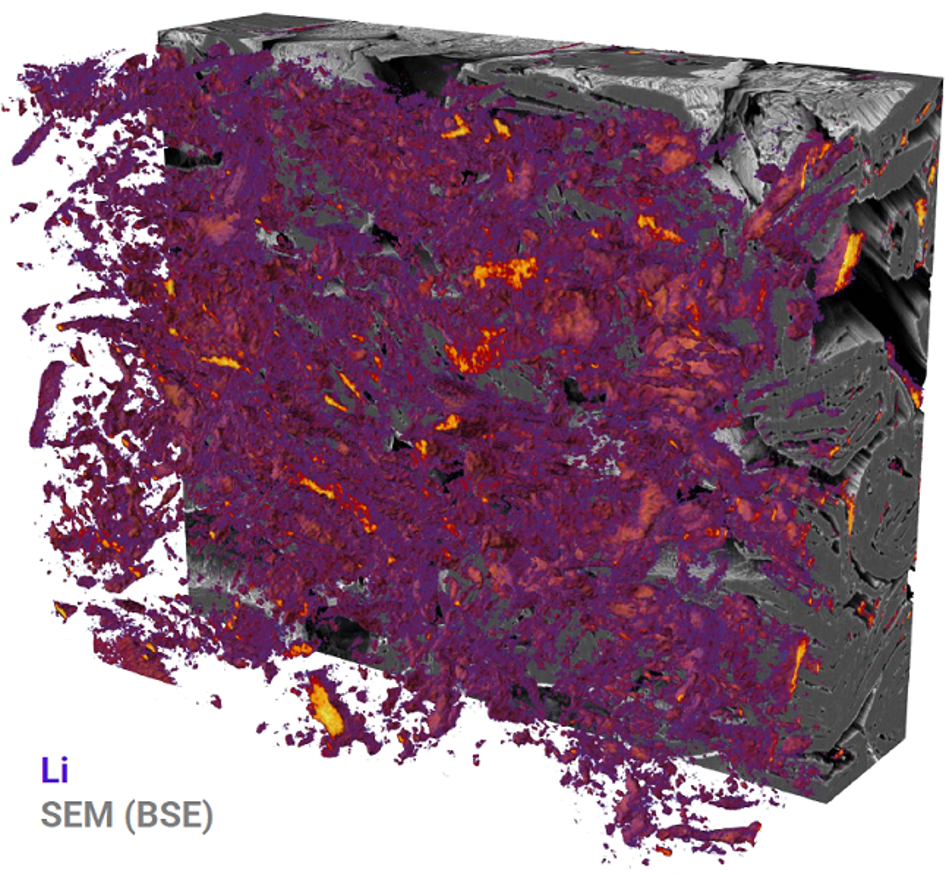
Figure 7. 3D FIB-SEM and 3D ToF-SIMS tomography of a cycled graphite anode. Analyzed volume = 60 x 50 x 20 µm3. Image Credit: TESCAN Group

This information has been sourced, reviewed and adapted from materials provided by TESCAN Group.
For more information on this source, please visit TESCAN Group.