Locard’s exchange principle, which states that “every contact leaves a trace” drives the concept of “trace evidence” in the forensic sciences. Trace evidence is usually classed as fine particles, which include hair, skin, fibers, clothing, soil, paint, and glass, among other materials.
Identifying unknown particles by comparing SEM/EDS data with reference materials is helpful as it delivers fast results that describe particle composition and morphology across an otherwise limited sample preparation.
This article describes how scanning electron microscopy (SEM), energy dispersive spectroscopy (EDS), and X-Ray micro-computed tomography (CT) can be leveraged to analyze glass particles and link them to the glass covering a smartphone.
A trace evidence scenario was simulated by subjecting an iPhone 4S to a gunshot. This simulation generated glass particles from the iPhone’s front and back covers. These particles were gathered up and served as a model case study for particle analysis and comparison.
The iPhone’s condition was recorded using a TESCAN VEGA SEM before and after the test-firing (Figure 1). A comparative analysis reveals the extent of the damage that caused particles to be generated.
To properly image the entire phone, a large chamber and stage were required in addition to wide-field scanning, panorama image stitching, stereo image acquisition, variable pressure conditions, 3D reconstruction, large area EDS X-Ray mapping, and SEM/EDS particle analysis.
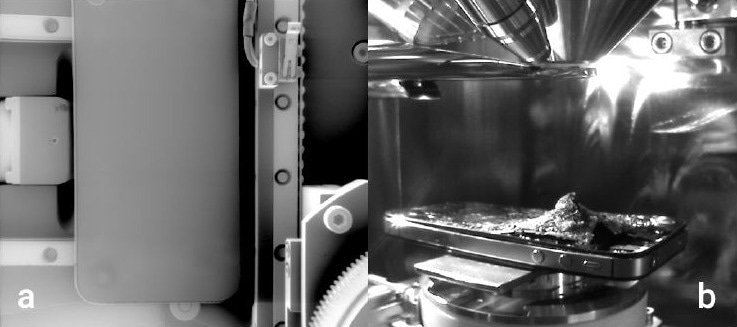
Figure 1. iPhone in the VEGA SEM chamber. (a) Wide-field SEM image of an entire iPhone 4S. This is a single image with a field-of-view (FOV) of 128 mm. The wide-field scan mode is unique in providing very large field-of-view image with little distortion. (b) Chamberview image of the iPhone 4s on the VEGA SEM stage, after a single shot from a .22 caliber revolver. The exit cone that was created by the round is facing upward, toward the microscope’s objective lens. The bullet struck the front side of the phone, in the upper area of the display and it did not fully penetrate the backside of the case. Image Credit: TESCAN USA Inc.
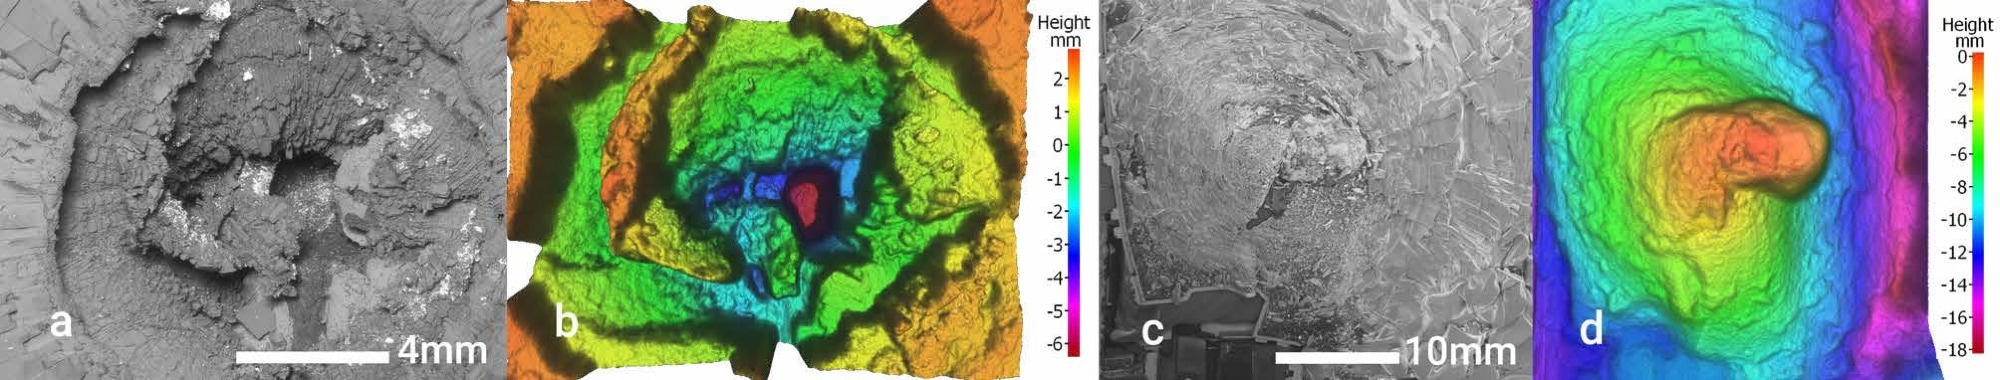
Figure 2. Entrance & exit imaging. (a) Depth mode backscatter electron image of the entrance crater acquired at 30 kV, 70 mm WD,10 Pa, resulting in 12.3 mm of depth-of-field. (b) Digital elevation model (DEM) of the entrance crater showing a change in height across the crater of more than 9mm. (c) Wide Field mode variable pressure secondary electron image of the exit cone acquired at 25 kV, 45 mm WD, 15 Pa, resulting in 41 mm field-of-view. Wide field mode is hyperfocal, meaning that its depth-of-field is several centimeters. (d) Digital elevation model (DEM) of the exit cone showing a change in height across the crater of more than 19mm. Image Credit: TESCAN USA Inc.
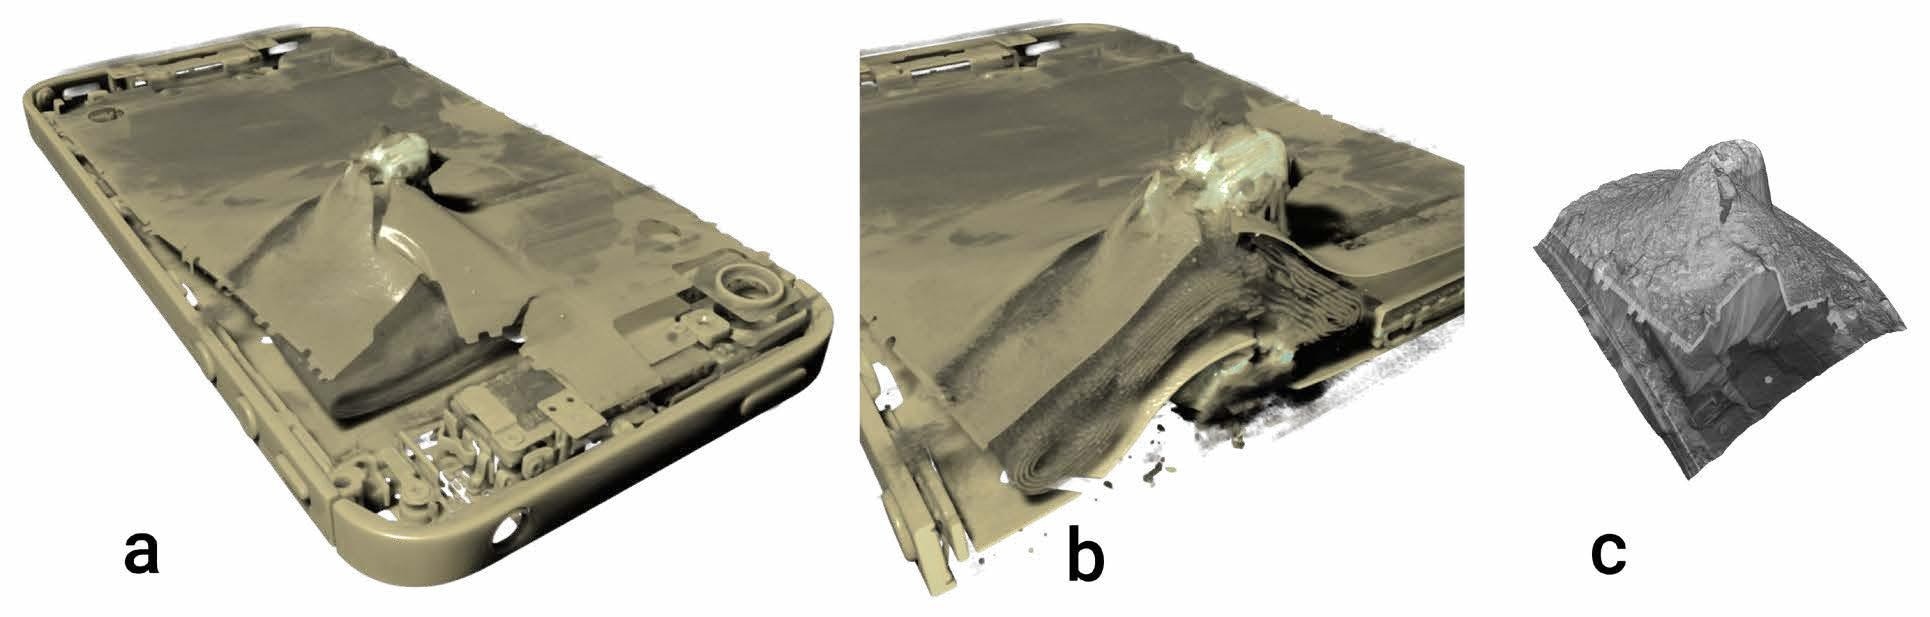
Figure 3. micro-CT & SEM digital elevation model of exit cone. (a) micro-CT visualization of the entire back surface of the iPhone showing the damaged area around the bullet, the bullet itself & components below the backside surface at the top of the iPhone. (b) micro-CT cross section showing damage to the iPhone battery near the bullet path. (c) SEM DEM of the exit cone rendered to match fig. 3a. The SEM and micro-CT data can be correlated to provide more information about the surface and understand what lies beneath the surface. Image Credit: TESCAN USA Inc.
X-Ray CT analysis of the iPhone was also carried out, and the results were used to generate a direct correlation to the results of the SEM 3D image reconstruction. Artifacts are seen in the image as the SEM electron beam generates charges across the iPhone surface due to the glass covering of the iPhone being non-conductive.
These charging effects are countered by initiating the variable pressure mode at low-voltage working conditions for imaging in the SEM. Top-down SEM imaging of the entrance and exit is valuable when visualizing coarse and fine details. However, this offers little information regarding the Z-dimension of the surface (Figure 2a & Figure 2c).
Stereo imaging and 3D analysis show that the bullet partially exited from the rear of the iPhone. SEM stereo images can be generated by imaging the same field of view and positioning the stage at different tilt angles for the capture of the image pair.
An anaglyph image is created by combining the source images to create a single picture, with each image displayed in a separate color plane. A stereo anaglyph image offers a three-dimensional view of the surface by relying on the human eye to perceive the disparity of single points in the images as depth.
The set of images can also reveal quantifiable details about the surface by simply processing image sets to create a digital elevation model (DEM).
The image processing is able to detect the same point in both source images while calculating the relative height of each point in the field of view. This generates a polygon model of the surface, overlaying it with the SEM image data for texture and shading and encoding height data through color mapping (Figure 2b & Figure 2d).
Imaging in 3D with SEM is an effective way to analyze three-dimensional topographic features of the sample’s surface. However, a complementary approach is required to assess the morphology and damage patterns of the phone’s interior. X-Ray micro-computed tomography (micro-CT) can be utilized for non-destructive 3D imaging of the phone’s full volume.
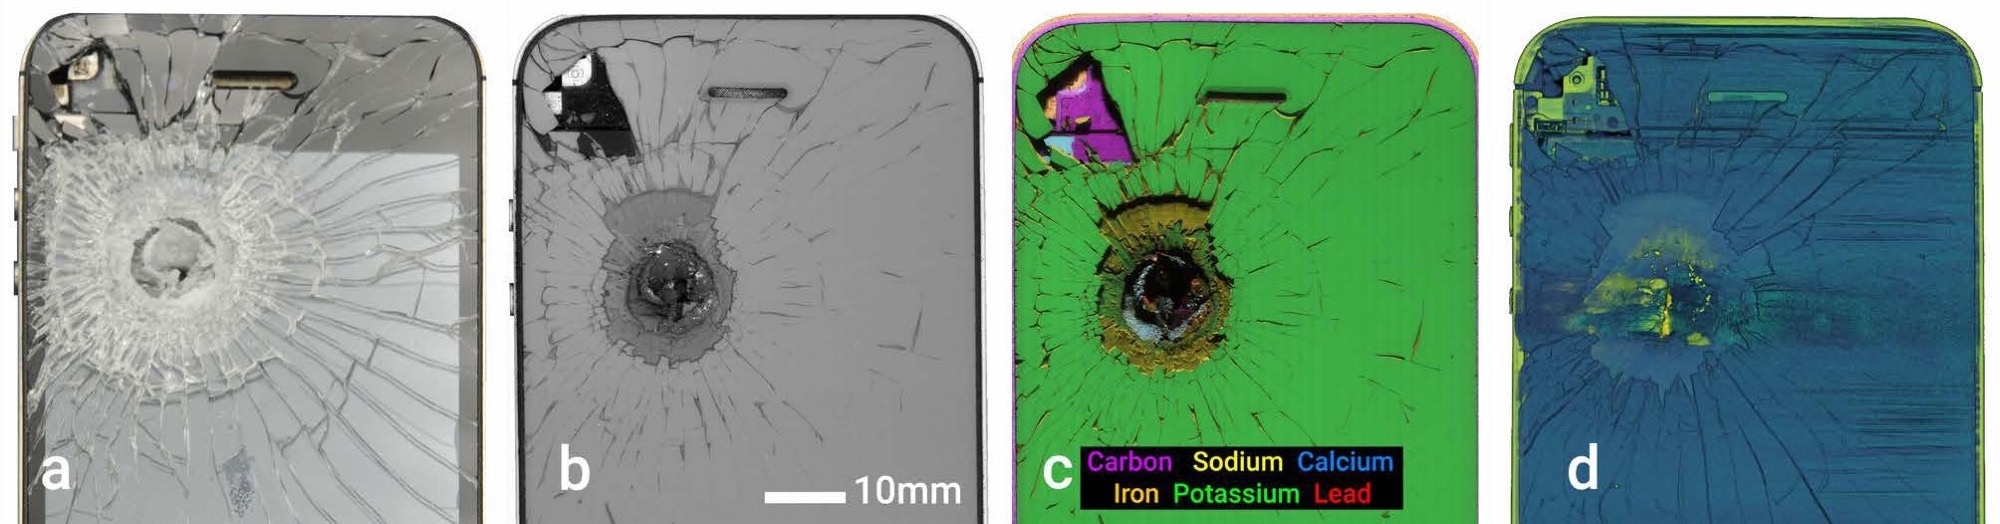
Figure 4. Correlative imaging. (a) Macro photo of the frontside of the iPhone. (b) Panorama backscatter electron image of the frontside of the iPhone stitched from 1620 automatically acquired image tiles at 30 kV, 26 mm WD & 15 Pa, covering an area of 60 mm x 63 mm. (c) Large area EDS x-ray map of the frontside of the iPhone stitched from 1998 automatically acquired EDS x-ray maps at 20 kV, 16 mm WD & 10 f Pa, covering an area of 60 mm x 63 mm with 12 um pixel spacing. (d) Micro CT virtual slice of the frontside surface of the iPhone. Image Credit: TESCAN USA Inc.
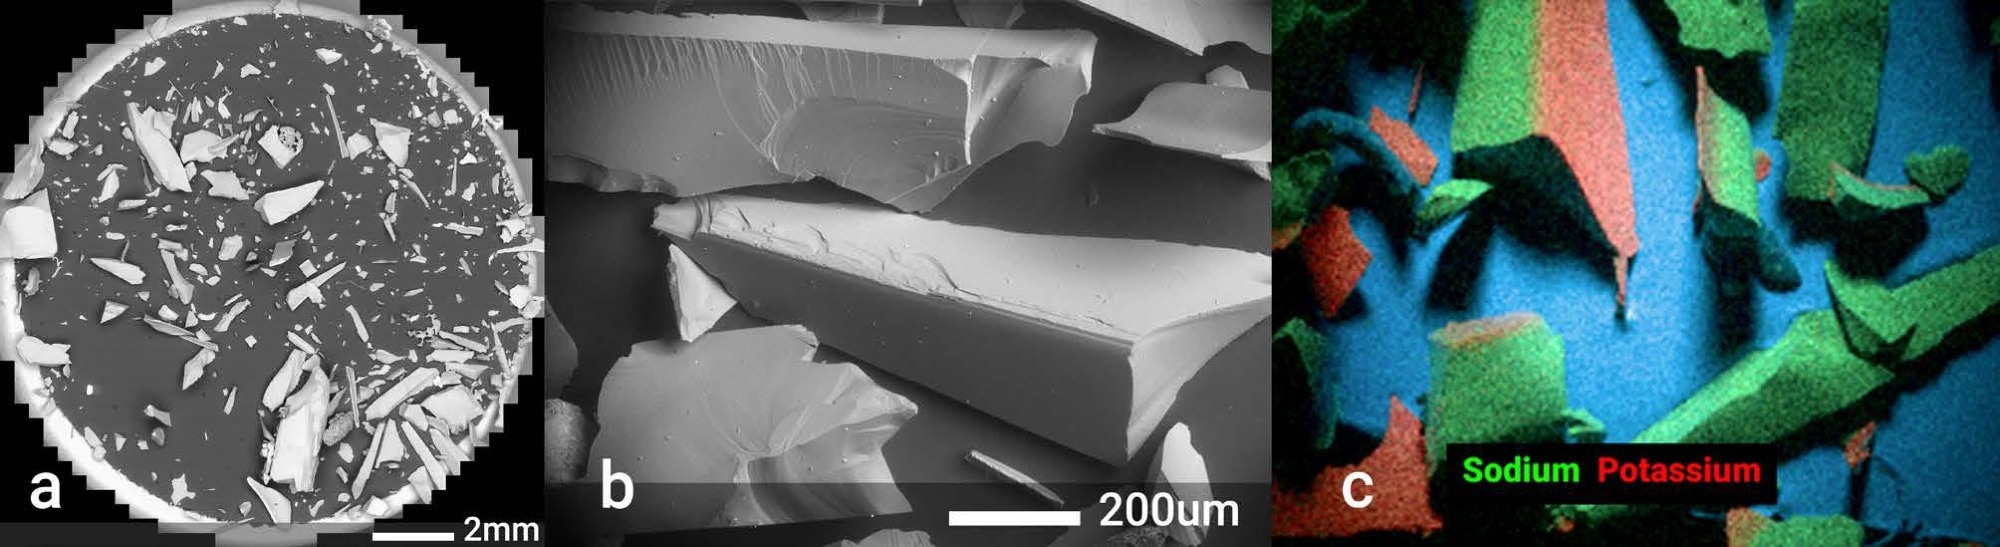
Figure 5. Imaging & mapping of particles from the iPhone. (a) Panorama backscatter electron image of a 12.5mm stub used to collect particles liberated from the iPhone cover, stitched from 1167 automatically acquired image tiles at 20 kV, 16 mm WD & 20 Pa. (b) Depth mode variable pressure backscatter electron image acquired at 20 kV, 15 mm WD & 20 Pa of a single particle that shows both the top surface and the bulk areas of the glass. (c) EDS x-ray map showing particles randomly oriented, including the particle showing both top and side surfaces. Image Credit: TESCAN USA Inc.
To visualize the entire iPhone volume, a TESCAN UniTOM XL was used for the analysis. The X-Ray tomogram (Figure 3a) reveals that the bullet remained in the iPhone, only penetrating the back side partially. The bullet passed through the phone’s battery (Figure 3b) and bullet fragments are shattered throughout the device.
Naturally, micro-CT can be used to study external features, such as the fractured glass surface. Moreover, the 3D volume can be leveraged as a navigation tool for SEM and other techniques to cover precise locations across a correlative workflow (Figure 3c).
Forensic scientists depend upon an extensive range of information to establish the origin and nature of evidence. For instance, the iPhone cover is fabricated using an alkali-aluminosilicate glass sheet.
This specific type of glass owes its surface strength, capacity to contain flaws and crack resistance to an immersion process that uses a proprietary potassium-salt ion exchange bath during manufacturing.
The immersion process means the surface of the glass contains increased levels of potassium and depleted levels of sodium to a depth of tens of micrometers. This unique chemical profile is to establish how the iPhone glass fragments are distributed and to tell them apart from other particles in samples collected at different locations.
The same frontal area of the iPhone is displayed throughout Figures 4 a-d. Using TESCAN’s Image Snapper tool to generate a panoramic image can be a useful complement to wide-field imaging.
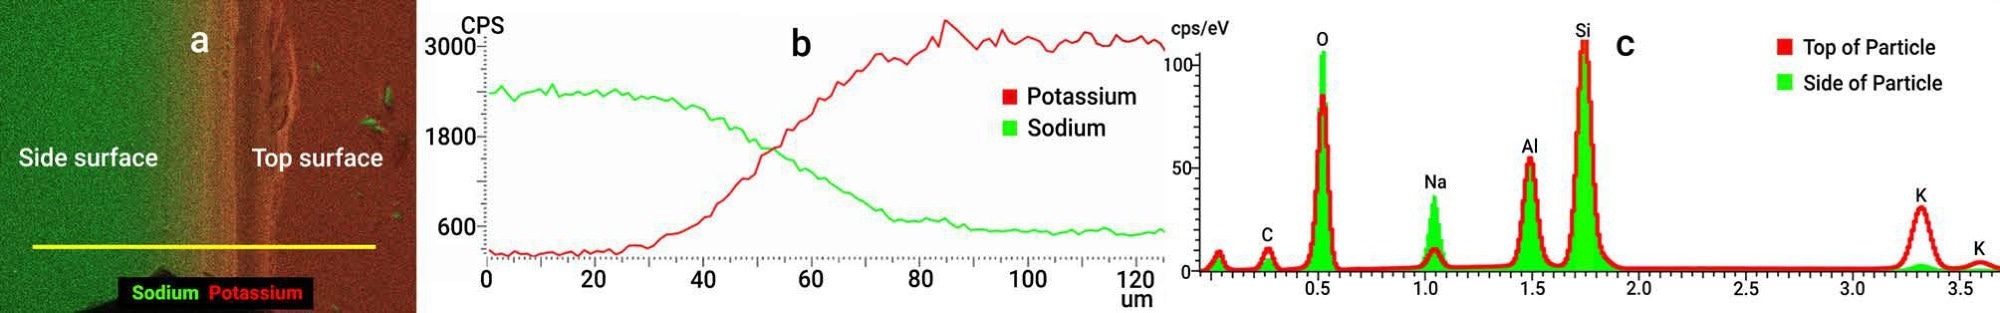
Figure 6. EDS analysis of glass particle. (a) Higher resolution x-ray map across the top-side boundary of the particle in fig. 5b. (b) EDS x-ray linescan of the trace defined in fig 6a, showing the complementary decrease in sodium concentration and increase in potassium concentration, moving from the side to the top surface. (c) Comparison of the side and top areas with summation spectra created from the center of each area. The relative peak heights of sodium and potassium illustrate a significant change in chemistry. Image Credit: TESCAN USA Inc.
While wide-field imaging captures a single image across a very large field of view, panoramic imaging captures an array of image tiles across a large area.
The stitched panorama offers both an extensive field overview and high-resolution image information. Acquisition of optical, backscatter, and X-Ray data at a fine spatial resolution over a large area can facilitate the correlation of coarse and fine details in the phone’s fractured surface.
Each image (Figures 4 a-d) can be transmitted to the TESCAN Positioner tool and calibrated to the stage as a multilayer map to navigate the sample and determine which areas should be subjected to further analysis. While the iPhone’s surface did not feature many particles, the container in which the iPhone was held during the test firing collected a great number of them.
An SEM stub was used to collect several of these particles and the SEM panorama image of this stub is displayed in Figure 5a. High magnification imaging, as displayed in Figure 5b, found that a number of particles have one very flat surface with other surfaces that demonstrate features typically associated with glass fracture.
The X-Ray map of the field-of-view shows particles dispersed randomly, with some being sodium-rich and others being potassium-rich at the surface level (Figure 5c).
The difference in sodium and potassium content can be mostly explained by the proprietary salt bath used during iPhone manufacturing. Moreover, the fact that some particles on the tape were gathered with the original surface of the display facing upward, while others landed with the fracture surface of the interior of the glass sheet facing upward explains some of the same findings.
A linescan across a single particle edge (Figure 6a) reveals the phase relationship. This is clearly displayed in the X-Ray map, as well as via X-Ray linescan (Figure 6b), and by comparing the X-Ray spectra (Fig. 6c).
Conclusions
This article outlines the capacity of the TESCAN VEGA SEM and its ability to find a match between a glass particle and its source on the surface of an iPhone via SEM, EDS, and micro-CT analyses.
Image acquisition was contingent on the use of variable pressure imaging conditions, as well as wide field, depth, and resolution scan modes.
The TESCAN Image Snapper tool was employed repeatedly to generate panoramic images, which facilitated the correlative analysis of SEM, micro-CT, EDS and optical data.
To connect the surface and topography data, SEM 3D reconstruction and micro-CT imaging were used, which also offered insight regarding the damage to the phone’s interior.
EDS microanalysis data in the form of spectra, line scan, mapping, and large area mapping were taken from samples to determine the compositional variations within the glass, offering conclusive evidence of the glass’s origin.
References
- Miller, Marilyn T. “Locard Exchange Principle.” Crime Scene Investigation Laboratory Manual, 2014, pp. 15–20., doi:10.1016/ b978-0-12-405197-3.00003-4.
- www.bentglassdesign.com. “A Brief Explanation of Chemically Strengthened Glass.” Glassonweb.com, Glassonweb. com, 27 Sept. 2016, www.glassonweb.com/article/brief-explanation-chemically-strengthened-glass.
- Weaver, James C., et al. “Wide-Field SEM of Semiconducting Minerals.” Materials Today, vol. 13, no. 10, 2010, pp. 46–53., doi:10.1016/s1369-7021(10)70186-3.
- “Anaglyph 3D.” Wikipedia, Wikimedia Foundation, 20 Jan. 2021, en.wikipedia.org/wiki/Anaglyph_3D.
- Wozniakiewicz, Penelope J., et al. “Preparation of Large Stardust Aluminum Foil Craters for Analysis.” Meteoritics & Planetary Science, vol. 53, no. 5, 2018, pp. 1066–1080., doi:10.1111/ maps.13052.
- Thompson, Keith. “Large-Area Quantitative Phase Mapping in the Scanning Electron Microscope.” Microscopy Today, vol. 25, no. 2, 2017, pp. 36–45., doi:10.1017/s1551929517000153.

This information has been sourced, reviewed and adapted from materials provided by TESCAN USA Inc.
For more information on this source, please visit TESCAN USA Inc.