Micro-computed tomography (micro-CT) is considered an essential tool for characterizing the internal structure of samples in a non-destructive manner. Although micro-CT technology is great for assessing morphological parameters, such as porosity, volume fraction, and orientation, or for showing defects in manufactured components, it can fail to detect and identify various phases or elements inside these samples. If there is no prior knowledge of the materials in the sample, this presents a serious challenge.
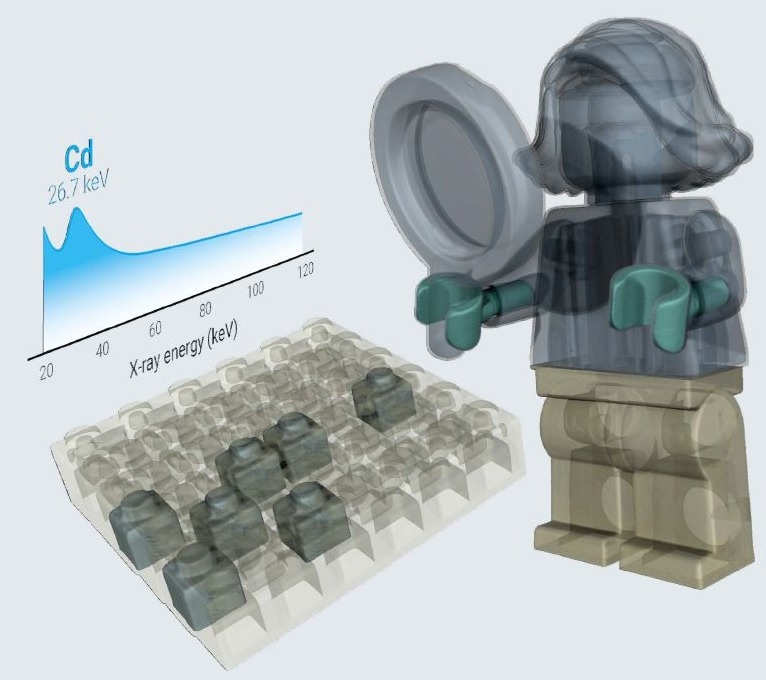
Image Credit: TESCAN USA Inc.
One example of this is attempting to differentiate carbon-based materials, such as plastics, polymers, and rubber. The principles fundamental to X-Ray imaging make it a challenge when trying to compare such materials with traditional CT scanning alone.
However, the capacity to differentiate between different plastics or compounds of rubber is indispensable in areas such as waste sorting and recycling, and new techniques are emerging as sustainability becomes an increasingly important topic.
This article describes how TESCAN Spectral CT can be used to enhance contrast among low-attenuating materials using LEGO® bricks as a case study. The aim is to show how the materials that make up one of the world’s most celebrated toys can be categorized into different material classes using a workflow that can be applied to the characterization of other low-attenuating materials.
Increased Contrast with TESCAN Spectral CT Imaging
The differences in attenuation of sample materials are used as the basis for contrast in micro-CT scans. Attenuation depends on the X-Ray energy used to analyze the density of the materials in a sample, but it is the atomic number of these materials that has the main influence on this property.
Materials of similar composition, which often consist mostly of carbon with some lighter elements, are difficult to tell apart using traditional micro-CT analysis methods.
In the example described in this study, LEGO® bricks were chosen to demonstrate the ability of the TESCAN Spectral CT to distinguish low-attenuating materials.
LEGO® bricks can be recognized almost anywhere, making them one of the most characterized and studied plastics, so they are a prime example for explaining the spectral CT workflow. The sample analyzed in this study is a 6 x 6 grid of 1 x 1 size LEGO® bricks in various colors, sealed along all sides using long yellow bricks.
Figure 1 displays a conventional micro-CT slice of the sample, produced using the TESCAN UniTOM XL in standard micro-CT mode. The sample was scanned over a two-minute period at a voxel size of 50 µm, with an accelerating voltage of 160 kV.
This sharp conventional micro-CT dataset is ideal for volumetric data acquisition of the sample, such as material thickness, material orientation, sample size, and, of course, volume. However, all small LEGO® bricks show the same grey value and information regarding color or composition is all but lost by using micro-CT alone.
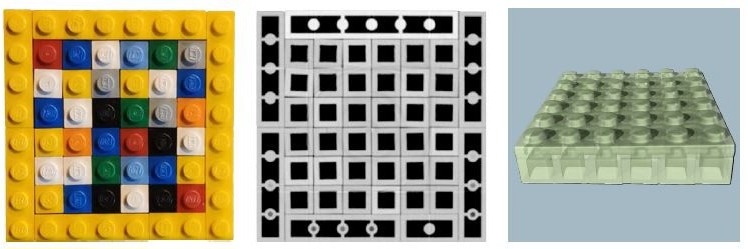
Figure 1. Left: LEGO sample consisting of 36 1x1 LEGO bricks. Middle: slice of a conventional CT scan of the sample. Right: 3D render of the 36 small LEGO bricks, where two different classes are visible. Image Credit: TESCAN USA Inc.
Additional analysis using spectral CT was conducted to differentiate the LEGO® bricks based on their color and composition. By using the TESCAN UniTOM XL’s PolyDET II detector, the complete attenuation spectrum attributed to the interaction between the polychromatic X-Ray beam and the samples can be clearly observed.
The detector tallies every photon that hits its surface after interacting with the sample. Concurrently, the energy of each of those photons is measured, generating a spectrum between 20 and 160 keV which facilitates an analysis of how photons of different energies interact with the various materials in the sample. All of this data is acquired in just one single CT scan.
The clear advantages of using spectral CT to boost contrast in low attenuation materials are shown in Figure 2. Figure 2a displays the image of a typical micro-CT scanner using an integrating, indirect detector which converts all X-Ray photons into visual light before they are detected, meaning all spectral information is lost.
Furthermore, high-energy photons emit a greater signal. This results in the low-energy photons, which are crucial for showing contrast in low attenuating materials, contributing less to the imaging process.
Spectral CT allows for changes to be made relative to how much each photon is weighted and thereby boosts contrast. In Figure 2b, each photon is equally weighted, as would be the case when using a conventional photon counting detector. This improves the contrast significantly.
When low-energy X-Ray photons are given more prominence, which only a true spectral CT detector allows, contrast is optimized, showing clear differentiation between various types of similarly composed plastic (Figure 2c).
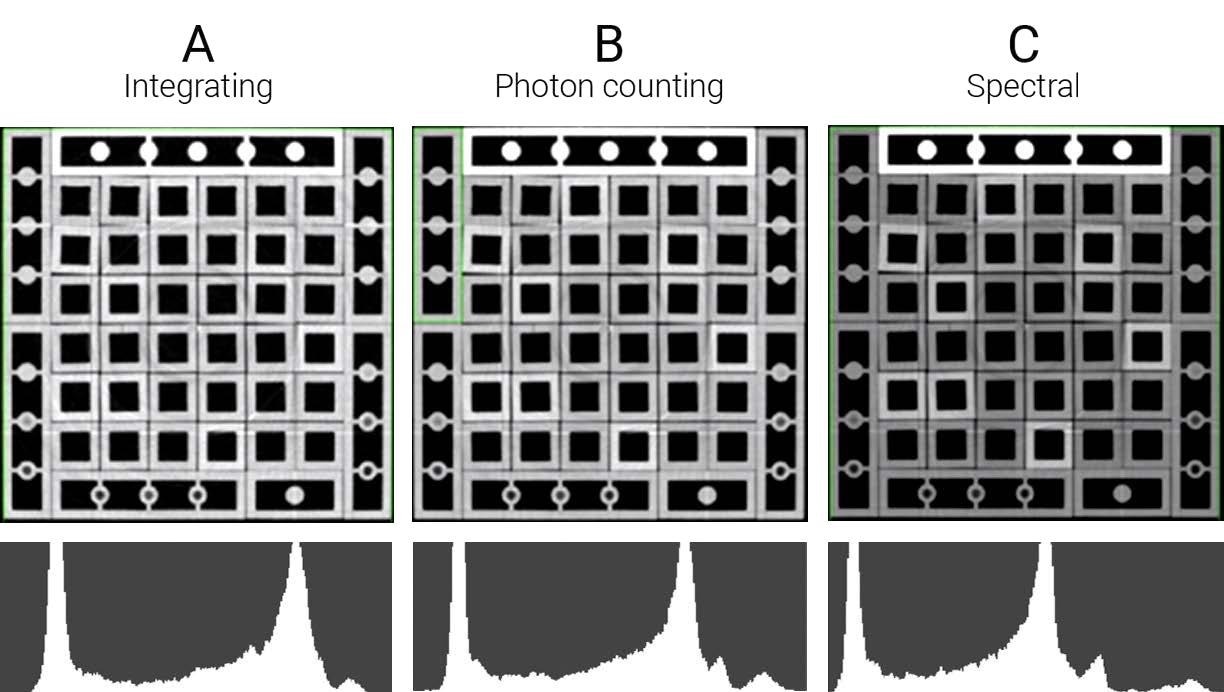
Figure 2. By using photon counting detectors in tandem with spectral CT, contrast in low-attenuation material can be enhanced, as is illustrated by the histograms of the images and the slice itself. Image Credit: TESCAN USA Inc.
Material Classification and Identification Using TESCAN Spectral CT
Beyond increasing contrast, spectral CT displays each voxel across a spectral dataset, with the complete X-Ray attenuation spectrum as a result of the interaction between X-Rays and the sample at that precise location.
Where the overall attenuation exhibits hardly any contrast when measured with standard CT, the full spectral data demonstrates clear differences between the various LEGO® bricks. Figure 3 displays the spectra of each individual brick, exposing a variety of shapes and suggesting different classes of materials.
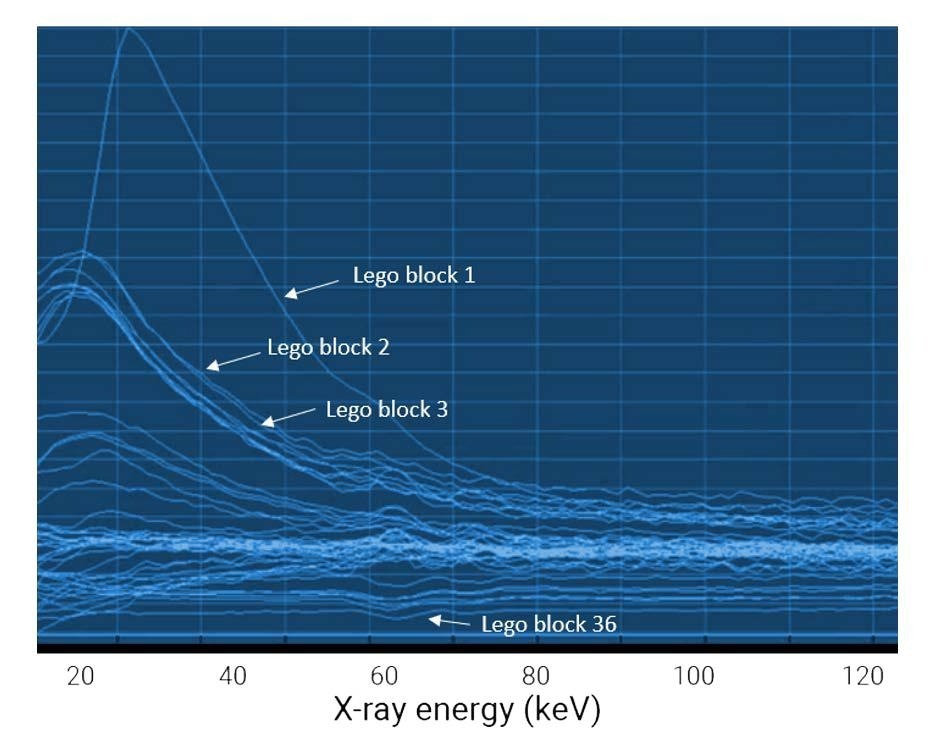
Figure 3. Attenuation curves of the 36 individual LEGO bricks. Image Credit: TESCAN USA Inc.
Comparing spectra offers an excellent visual differentiation across a variety of materials. However, it is not always easy to capture a perfect separation. TESCAN Spectral Suite™ makes it possible to match the measured spectra automatically with a reference database of LEGO® bricks that have been individually scanned.
Groups of similarly colored bricks were scanned using spectral CT, and their attenuation curves were stored as a reference for specific material classes to construct this reference database. Figure 4 clearly shows five different classes of bricks that can be identified.
White, grey, and light blue bricks can be differentiated from all other bricks and placed into their own material class. Red and black bricks are difficult to distinguish from one another but they clearly stand out from the other colors. Finally, the dark blue, yellow, orange and green blocks are combined to make up the fifth material class. Although imperfect, comparing spectra is a vast improvement when it comes to classifying materials using traditional micro-CT, which produces little to no contrast.
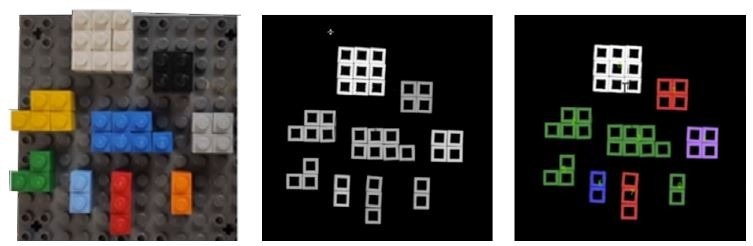
Figure 4. Sample to build a reference dataset for different material classes. Left: photo of the reference sample. Middle: spectral CT slice of the sample. Right: classification of the bricks in five material classes. Image Credit: TESCAN USA Inc.
After this reference dataset was constructed, TESCAN Spectral Suite™ was applied to classify the bricks automatically in the square sample. Without any additional user intervention, Spectral Suite assigns each of the bricks to a material class, revealing which class a brick corresponds to.
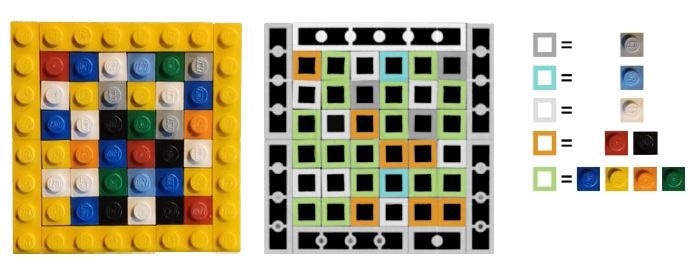
Figure 5. Automatic spectrum match segmentation on the LEGO brick sample enables segmenting the blocks in five different material classes. Grey, blue or white bricks can be positively identified, and a division of the other colors in two classes can be made. Image Credit: TESCAN USA Inc.
Multi-energy histograms offer another relatively easy way to visualize and analyze spectral data . Such histograms plot the attenuation value of a material across a certain energy range to the attenuation value of that same material across another energy range.
In this visualization, all voxels pertaining to a specific material are plotted on a straight line. The position on the line depends on the material’s thickness (in radiography) or density (in CT scans).
In Figure 6, the dual energy histogram of the LEGO brick dataset is displayed. This clearly indicates the five different material classes in a visual and intuitive way. As with the automatic spectral matching, this dual energy histogram can be applied when segmenting datasets in different classes, by partitioning the various lines or clusters across the dataset.
As a result of this action, the voxels that correspond to a specific elemental composition can be highlighted and added to a class. TESCAN Spectral Suite™ then leverages that input data to conduct a complete segmentation of the dataset in nine classes or run the same procedure on different datasets with similar materials.
This clearly shows that spectral CT is unparalleled when it comes to providing contrast based on extremely subtle differences in elemental composition, which is impossible using standard micro-CT scanning techniques.
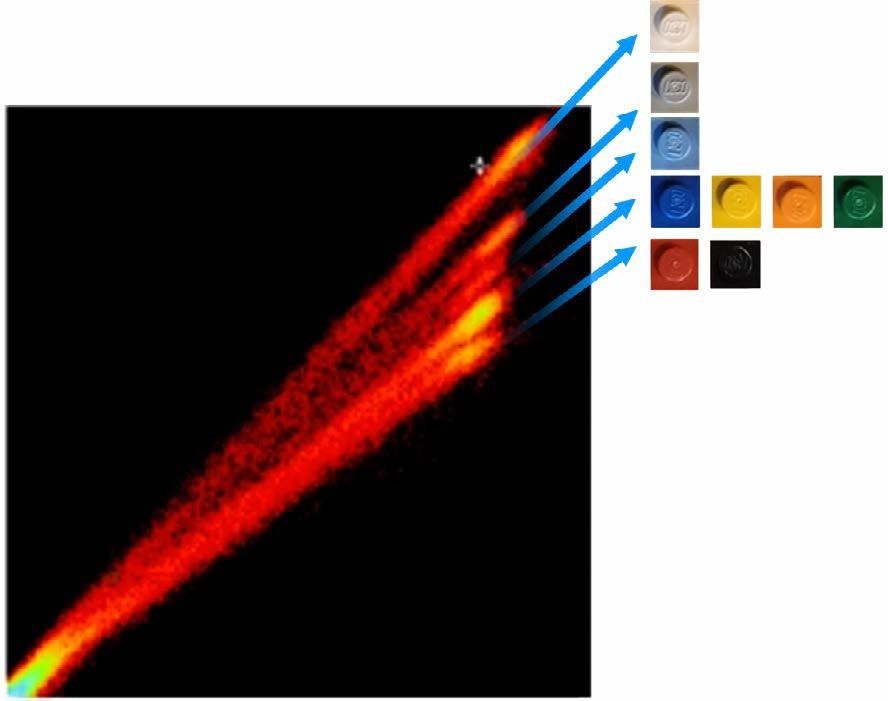
Figure 6. Dual energy histogram of the dataset showing the different material classes. Image Credit: TESCAN USA Inc.
K-Edge Detection: Identification of Unknown Materials
Through an evaluation of Figure 1, what clearly stands out is the long horizontal brick at the top of the image. Unlike the other bricks shown in the dataset, this one catches the eye by having a significantly higher grey value in a standard micro-CT image.
As previously mentioned, based on this standard image it can be concluded that the average atomic number of the materials in that particular brick is considerably greater than that of the other bricks in the sample. Unfortunately, that is the only conclusion that can be made using conventional micro-CT.
However, using spectral CT, based on k-edge detection, to analyze the spectrum facilitates the clear identification of the main atomic number in that sample area without any prior information.
To explain k-edge detection, go back to the fundamentals of micro-CT imaging. By and large, there is a decrease in X-Ray attenuation when the X-Ray energy increases. This X-Ray attenuation predominantly caused by photo-electric absorption, where the incident X-Ray photon is ceased entirely by knocking an electron out of one of the orbital shells of an atom in the sample.
If there is an increase in X-Ray, there is a smaller chance of such an interaction, and X-Ray photons permeate the atoms of the sample, passing all the way through. However, if the X-Ray energy is strong and able to overcome the binding energy of electrons closer to the atom’s core, a rapid increase in attenuation can be observed known as a k-edge.
In the LEGO® dataset, an analysis of the spectrum of the brighter long brick shows a clear attenuation peak at 26.7 keV (Figure 3). This indicates that this material is partly comprised of cadmium. Furthermore, the fact this carcinogenic metal appears in this particular brick indicates it is at least 40 years old. Until the 1980s, cadmium was regularly used as a coloring agent for yellow and red LEGO® bricks, reassuringly, this is well encapsulated in the plastic so there is minimal threat to public health.
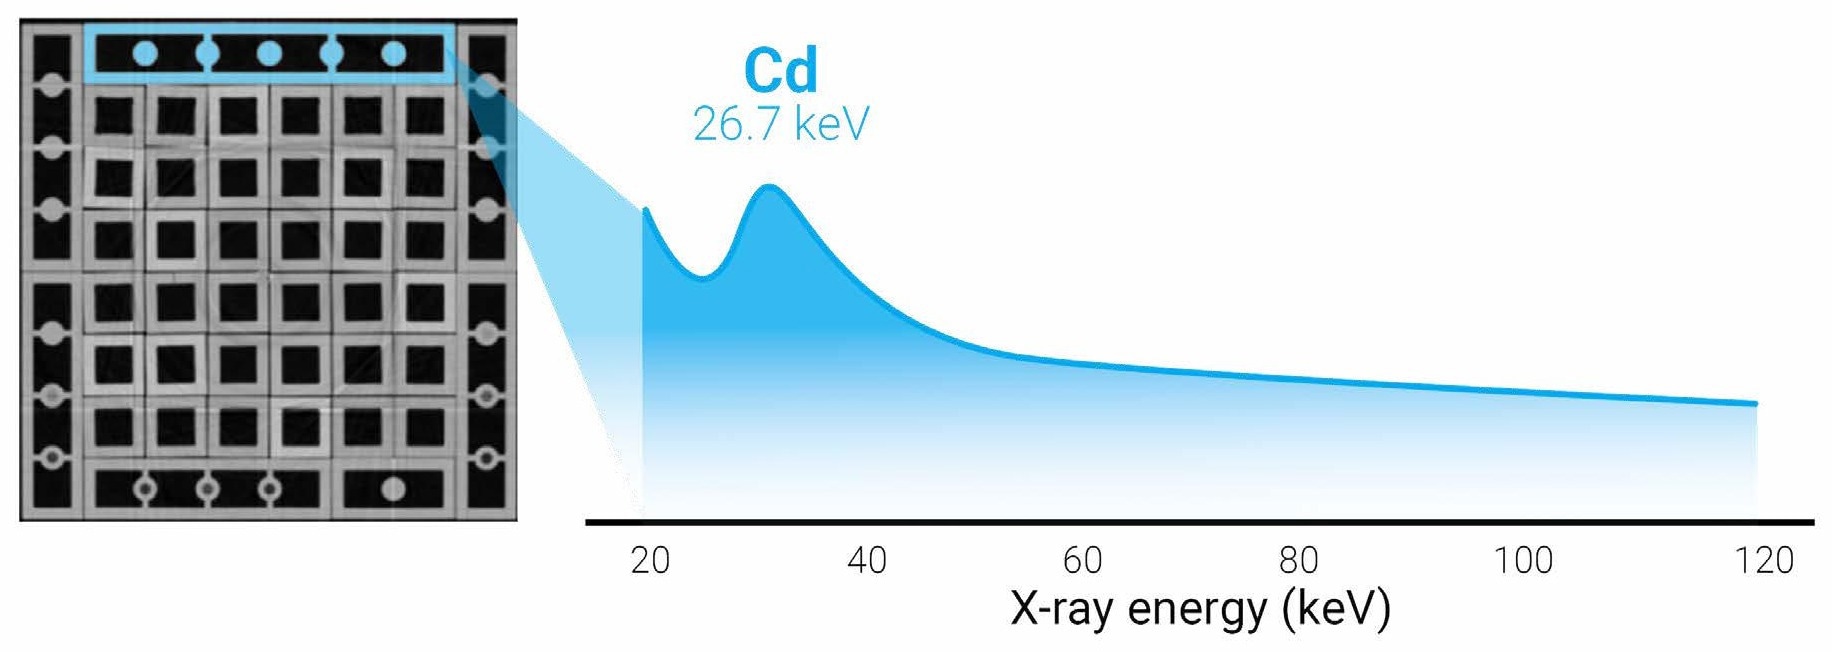
Figure 7. X-ray attenuation spectrum from the highlighted LEGO brick shows a clear k-edge at 26.7 keV, indicating the presence of cadmium. Image Credit: TESCAN USA Inc.
Outlook
This article describes the study in which true contrast was achieved across a sample of different colored LEGO® bricks. Serving as a surrogate for polymers with extremely similar compositions, the LEGO® bricks were imaged with the TESCAN Spectral CT.
Where traditional micro-CT does not have the capacity to differentiate between similar materials, TESCAN Spectral CT overcomes this obstacle by leveraging the complete spectrum of each singular pixel or voxel, fully exploiting the relationship between X-Ray energy and attenuation.
In addition to increasing contrast, the analysis of spectral CT data can be applied for the differentiation, classification, and even identification of different components. The workflow demonstrated here presents the potential for spectral CT scanning, and can intuitively be applied to other samples for which contrast in traditional micro-CT is extremely low. Differentiation between plastics or polymers has serious application use in industries such as the manufacturing of plastic components, the tire industry, and waste recycling.

This information has been sourced, reviewed and adapted from materials provided by TESCAN USA Inc.
For more information on this source, please visit TESCAN USA Inc.