Wind turbine blades are exposed to a diverse range of atmospheric and environmental conditions, such as rain or hail. This exposure, depending on the site, operational conditions, and blade type, leads to leading edge erosion (LEE) in varying degrees.

Image Credit: TESCAN USA Inc.
LEE is a well-documented phenomenon that has been extensively covered in research conducted by the aircraft and helicopter industries. However, the wind turbine industry appears to have struggled with this issue for some time. In this article we describe how X-Ray micro-computed tomography (CT) can be leveraged to facilitate the analysis of LEE at specific sites and also to evaluate the quality of the blade coating.
Research question: How do structural defects, such as voids and cracks, impact structural integrity in composite materials for wind energy applications?
Multi-Resolution Imaging
A composite material denotes when a material is made up of various non-homogeneous materials. A composite material is considered complex on the macro and micro-scale and requires a multi-scale imaging approach to acquire a complete overview of the internal structure.
Analysis Workflow
All 3D images were captured using the TESCAN UniTOM XL, TESCAN’s versatile, modular multi-resolution X-Ray CT system. To analyze the internal structure on the macroscopic scale, a full composite sample (approx. 40 cm in length) was thoroughly imaged.
From the overview image, regions of interest were selected for zoom scanning at higher resolutions. Subsamples were drilled out of the chosen regions and can be tuned for specific applications to boost the image quality, resolution, and throughput.
The TESCAN UniTOM XL can achieve true spatial resolution as low as 3 µm and can handle a diverse range of sample types and sizes up to 60 cm in diameter and 100 cm in height.

Image Credit: TESCAN USA Inc.
Overview Scan
Internal Macrostructure
The internal macrostructure of the composite structure can be visualized based on the overview scan of the whole blade. The blade is comprised of multiple layers of woven glass fiber as shown in the image below which displays a series of transversal slices. Pockets of air (pores) are present in the resin between the layers. Moreover, there is an additional coating that can be seen on the top of the composite.

Image Credit: TESCAN USA Inc.

Image Credit: TESCAN USA Inc.

Image Credit: TESCAN USA Inc.
Porosity Distribution
The pattern of the various pores is similar to that of the woven glass fiber structure as revealed through analysis of the pore space in the overview scan of the wind blade. Therefore, most of the pores detected in the macrostructure scan can be related to air bubbles trapped between the various glass fiber layers.
The pores in the image above are color-coded in accordance with the relevant diameter of the pore; blue represents the smaller pores and red the larger pores. The diameter of the majority of pores is shown to be less than 1 mm. The pore size distribution histogram signifies the necessity to perform a more detailed subscan.
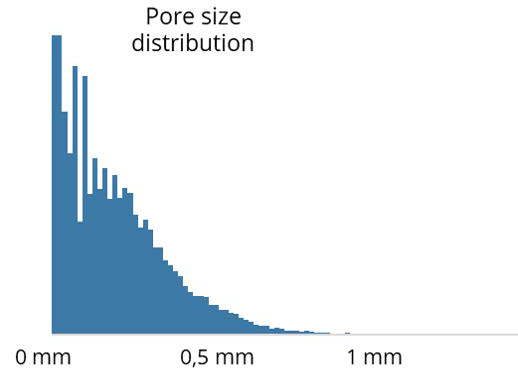
Image Credit: TESCAN USA Inc.
Volume of Interest Scan
To gain even more detail, users can simply zoom in by selecting a region on the reconstructed overview scan. The TESCAN UniTOM XL system has the ability to zoom in to the selected region and run a volume of interest scan (VOIS).
In this case, a region in the upper left of the blade was chosen as a distribution of larger pores can be seen (red in porosity distribution). The resolution in the detailed VOIS increased over five times (12 µm), offering new insights regarding the structure of the various layers and the presence of larger pores in this zone of the blade.
Larger pores are mostly related to undulations in the inner glass fiber layers and pockets of air between those layers. In the detailed VOIS, pores within the glass fibers layers and throughout the coating become visible. A crack that passes through the coating and into the resin below the coating can be seen.
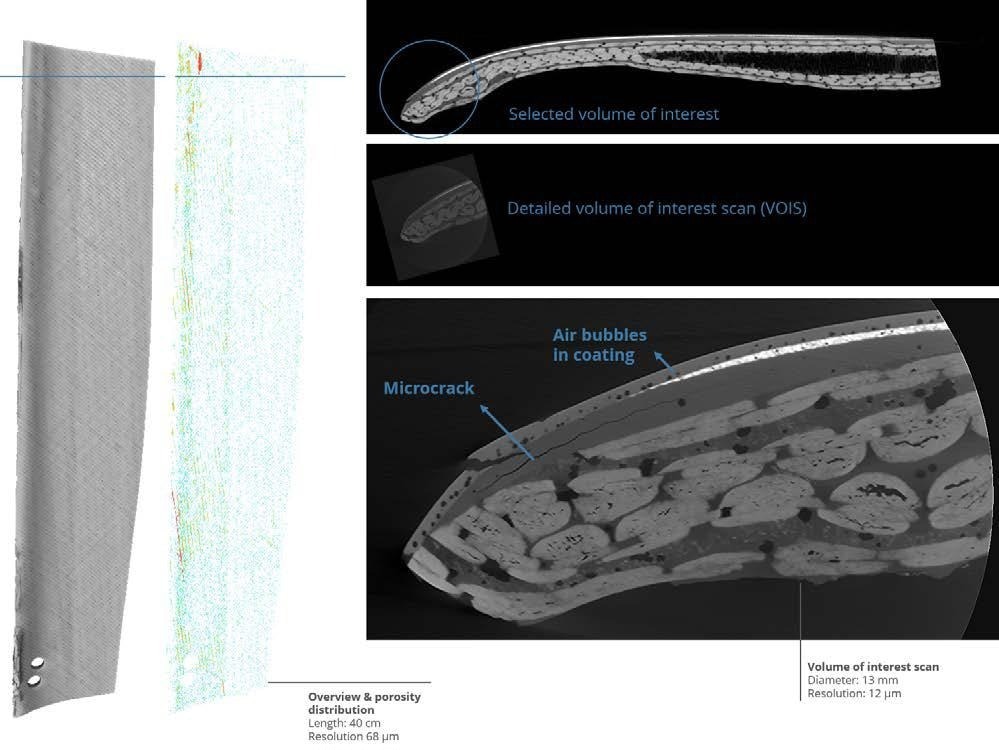
Image Credit: TESCAN USA Inc.
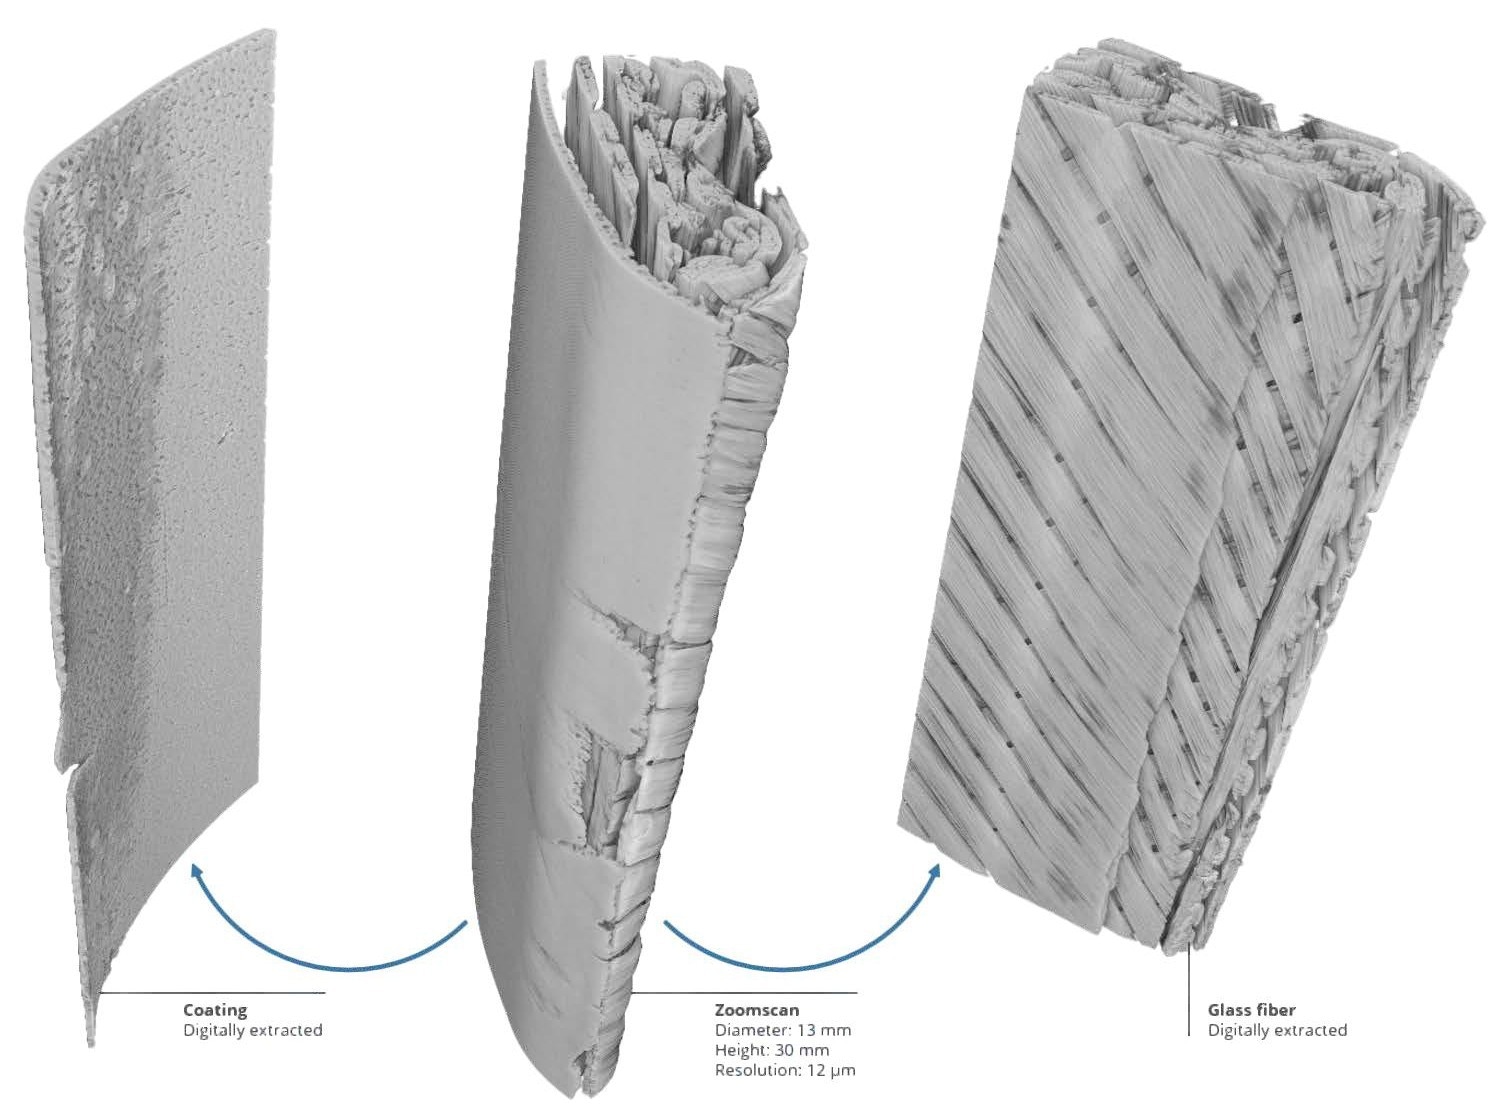
Image Credit: TESCAN USA Inc.

Image Credit: TESCAN USA Inc.
Coating
A coating is applied onto the composite structure to improve the material properties. Characterizing the various thin and widely distributed layers presents something of a challenge when using conventional methods.
The coating was virtually separated from the rest of the material by way of a zoomed scan. This interior perspective shows the presence of several tiny air bubbles distributed throughout the coating.
Subsample Scan
Subsamples of 5 mm diameter were drilled from selected regions in the larger blade perpendicular to the layers. Subsamples were scanned at 5 µm resolution and reveal particular details about the different layers.
Cross sections throughout the subsample display various classes of porosity and show individual glass fibers which can be distinguished in the high resolution detailed scan.

Image Credit: TESCAN USA Inc.

Image Credit: TESCAN USA Inc.
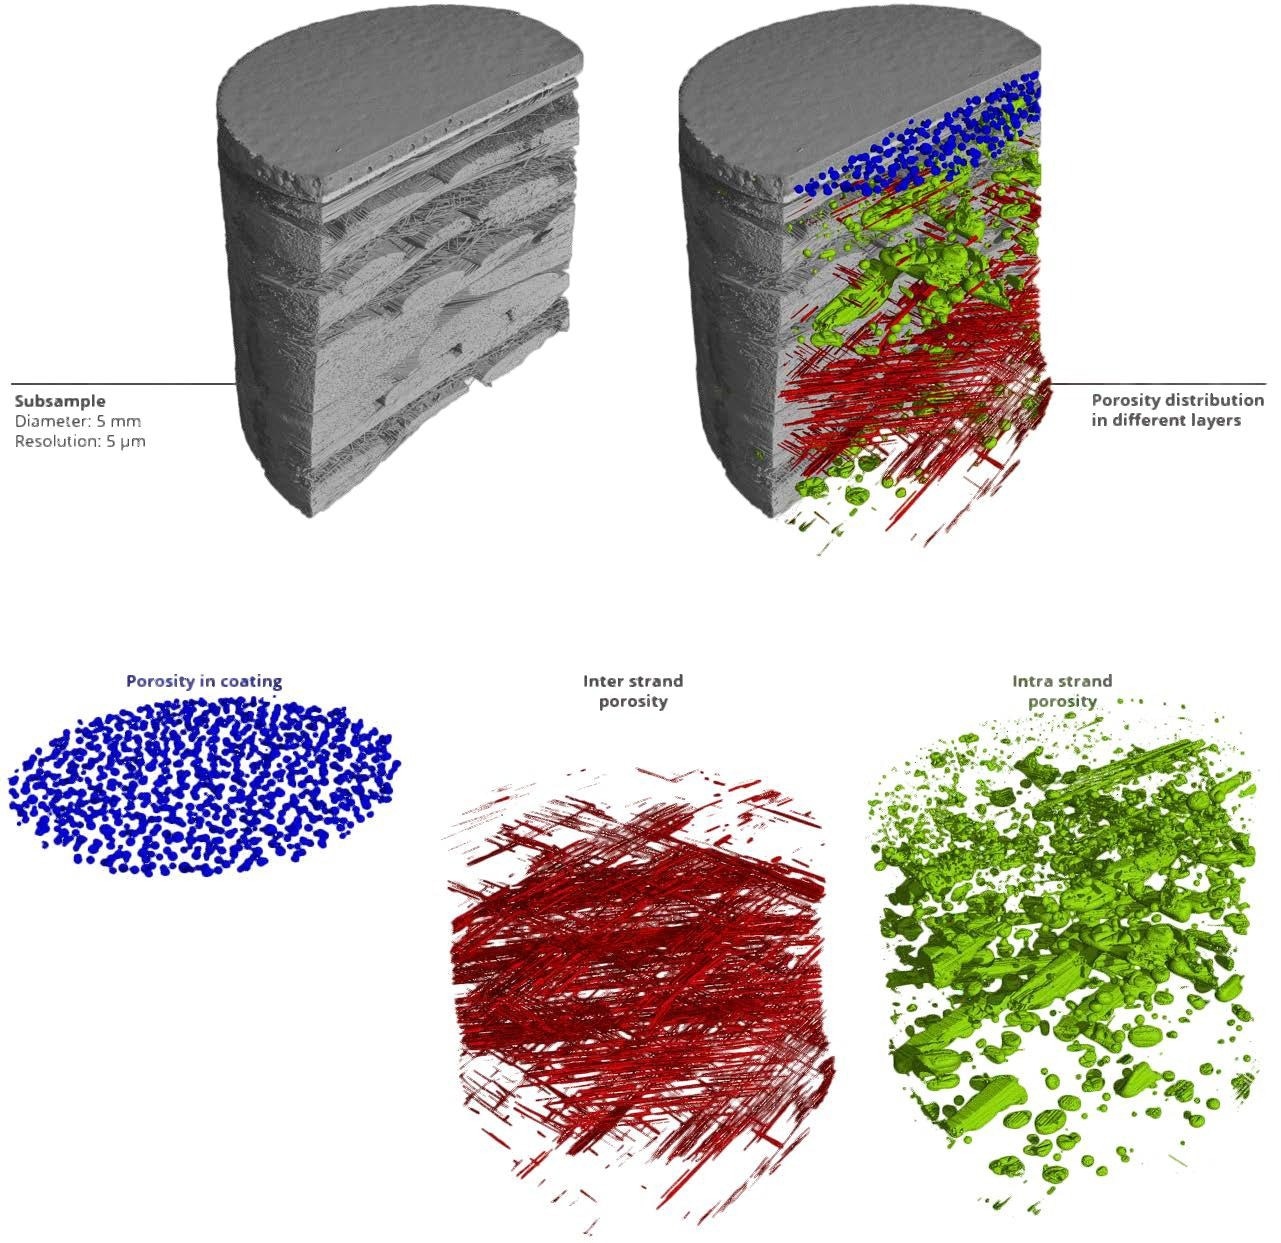
Image Credit: TESCAN USA Inc.

This information has been sourced, reviewed and adapted from materials provided by TESCAN USA Inc.
For more information on this source, please visit TESCAN USA Inc.