A focused ion beam scanning electron microscope (FIB-SEM) equipped with a compact time-of-flight secondary ion mass spectrometer (ToF-SIMS)1,2 and traditional energy dispersive X-ray spectroscopy (EDS) opens up new possibilities for characterizing lithium-ion battery components.3,4
However, the analytical data provided by SEM, EDS, and ToF-SIMS each have their unique characteristics and deliver different types of information (as illustrated in Figure 1). For example, SEM imaging captures the topography and structure of components with high spatial resolution but does not provide chemical composition data.
EDS enables element identification but struggles to detect X-rays from lighter elements, including lithium, and its spatial resolution is limited by the electron beam interaction volume.5
In contrast, the ToF-SIMS method offers more comprehensive insights into the chemical state of the analyzed material due to its ability to detect elemental, isotopic, and molecular fragments. Unlike EDS, ToF-SIMS is highly sensitive to lithium, making it a particularly valuable tool for the development of current energy storage technologies.
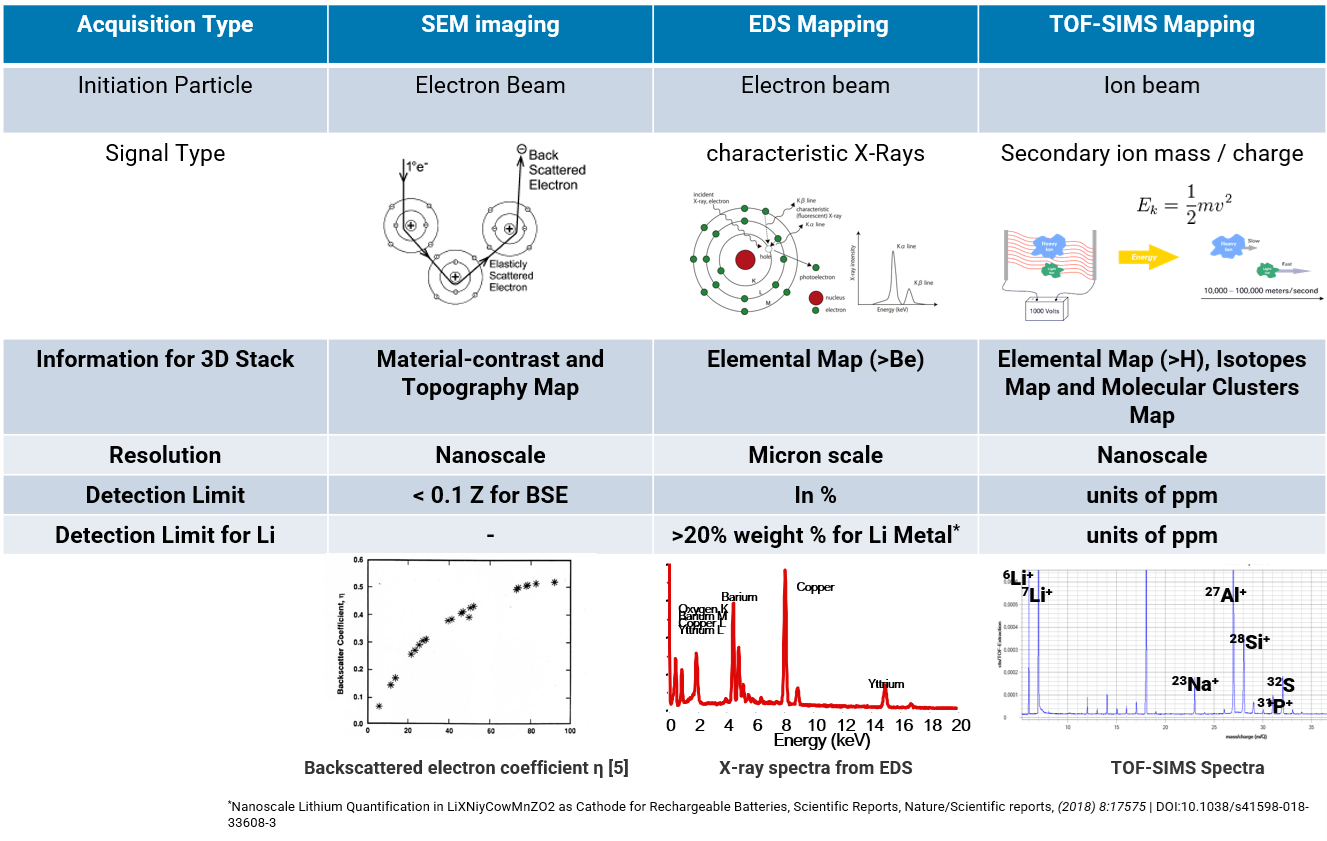
Figure 1. Comparison of analytical techniques and information available in FIB-SEM. Image Credit: TESCAN Group
Serial-Sectioning FIB-SEM Tomography
Various materials are typically studied through a two-dimensional approach, focusing on surface or cross-sectional analysis. While this 2D characterization can reveal basic compositional properties of the analyzed material, it does not provide complete information from a statistical perspective.
For example, it might not adequately demonstrate the relationship between chemical contamination and defects that appear during the battery's lifetime.
Three-dimensional information enables the localization of chemical information connected to volumetric objects like defects, pores, and particles. The basic volume analysis in FIB-SEM is based on FIB serial-sectioning and SEM imaging, which provides topographical and material contrast data collection capabilities (Figure 2).
Simultaneously, EDS and/or EBSD mapping has also become a frequent requirement, offering qualitative information on elemental distribution. However, the full 3D analytical potential was not fully realized until now (Figure 3).
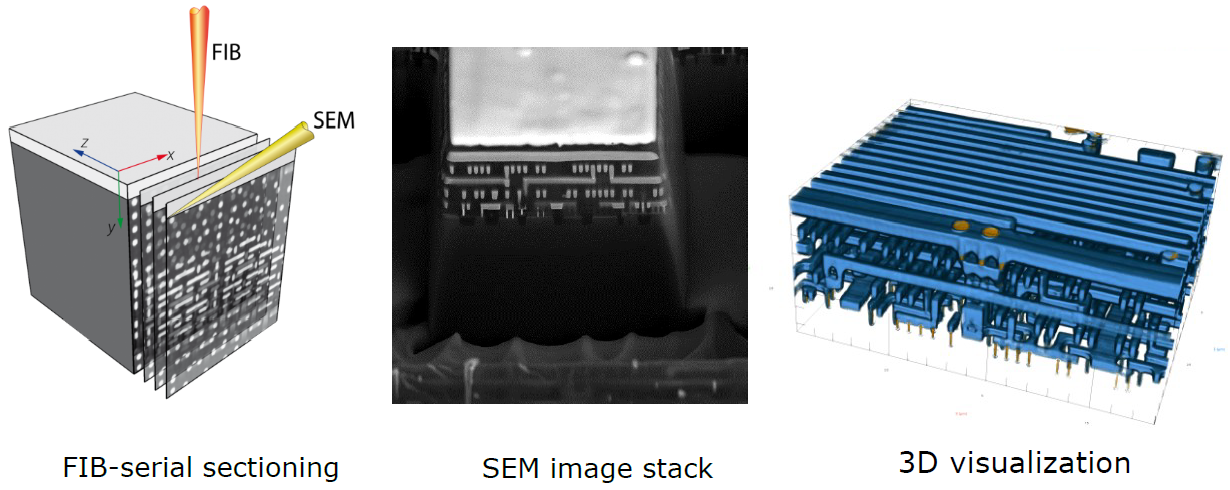
Figure 2. Schematic image of FIB-serial sectioning tomography workflow and 3D visualization using SEM images. Image Credit: TESCAN Group
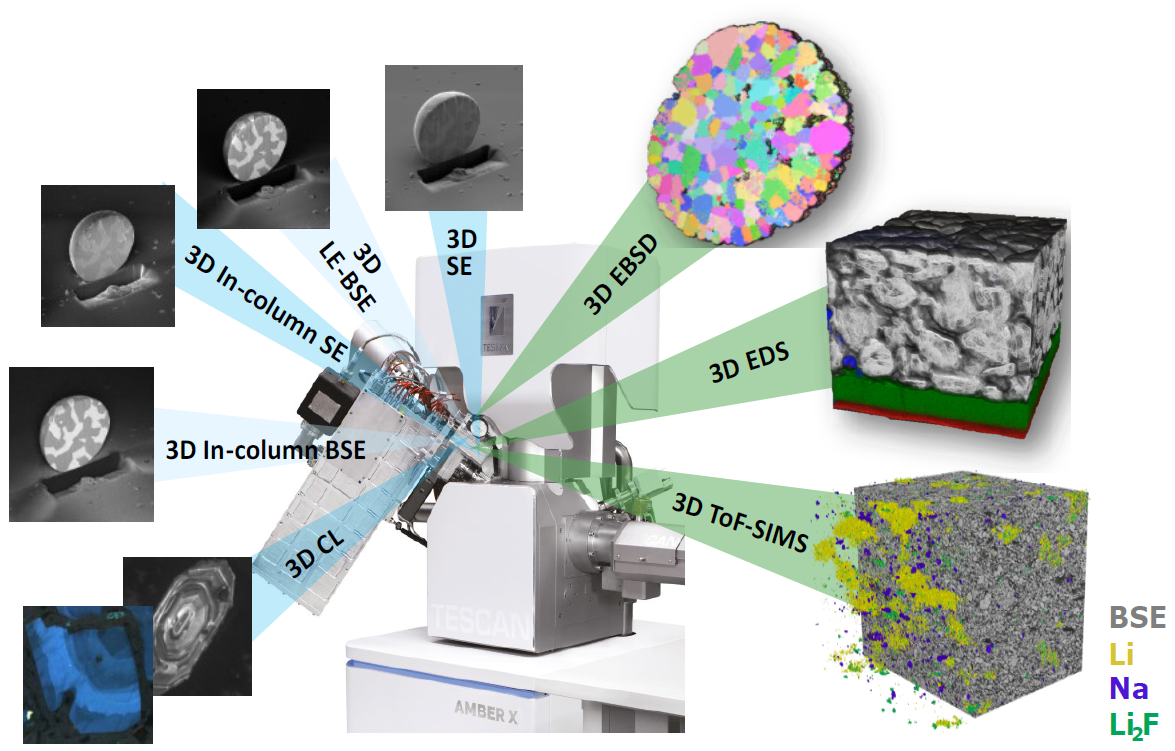
Figure 3. 3D analytical potential of TESCAN AMBER X FIB-SEM system. Image Credit: TESCAN Group
3D ToF-SIMS Tomography and Data Visualization
Compared to traditional ToF-SIMS analysis, 3D FIB-SEM tomography-based ToF-SIMS facilitates parametrical 3D visualization of Li and other elements/molecules and offers more detailed morphology and chemical data.
With a considerably lower impact of uneven local differences in the milling rate of heterogeneous battery materials, this approach takes advantage of techniques such as silicon masking and sample rocking to ensure optimal cross-section quality.
The integration of ToF-SIMS measurement into the serial-sectioning workflow (Figure 4) is achieved through manipulator movement, which adjusts the cross-section plane perpendicular to the FIB. This allows for ToF-SIMS data collection without the effects of shading or image deformation. This approach has been proposed previously, though in the context of a dedicated ToF-SIMS instrument with an additional orthogonal FIB column.6
During data acquisition, all information (ToF-SIMS, EDS, etc.) is stored with the complete spectral report. For visualization, TESCAN has developed a dedicated module for transforming spectra into 3D peak intensity maps (Figure 5).7
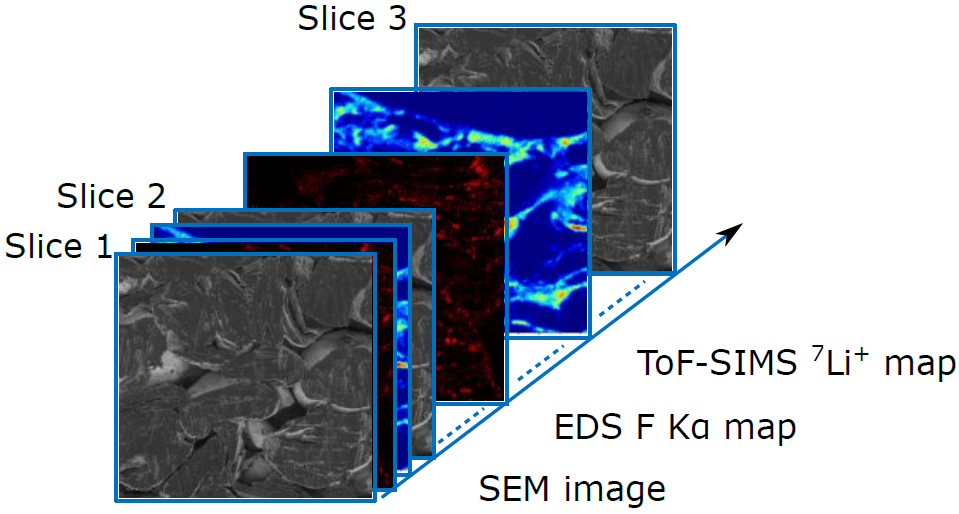
Figure 4. Schematic image of serial sectioning workflow with an illustration of sequentially acquired volume multispectral and multi analytical data. Image Credit: TESCAN Group
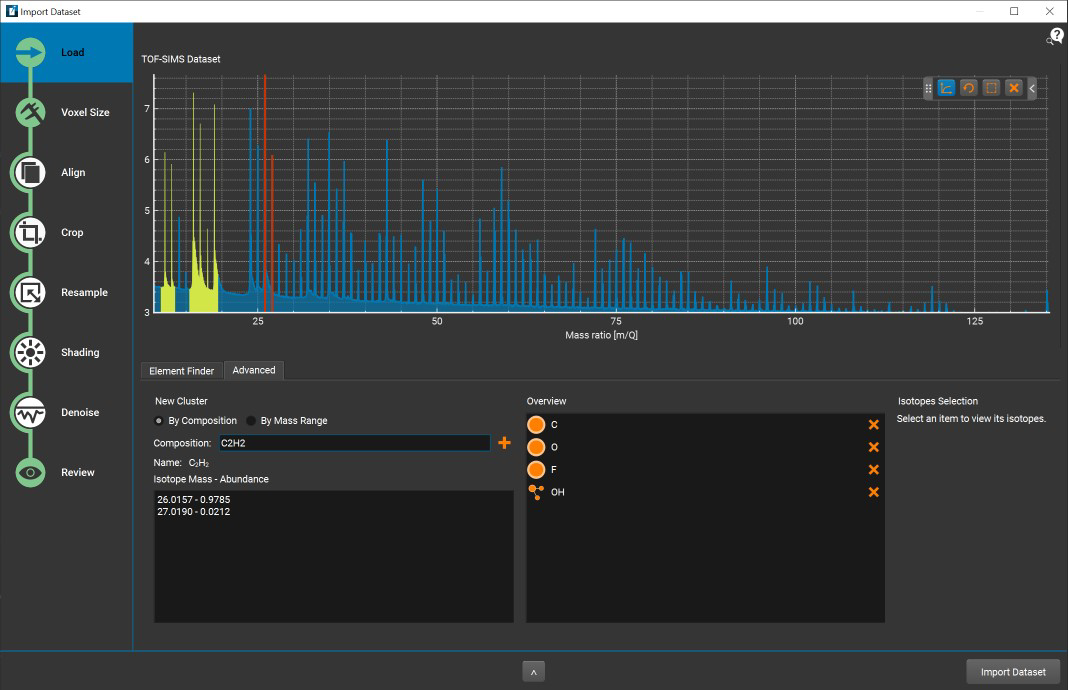
Figure 5. 3D ToF-SIMS spectral data preprocessing for 3D visualization. Image Credit: TESCAN Group
3D Multimodal Characterization of Lithium-Ion Battery Components
Using the above-described method, TESCAN has illustrated the comprehensive information that can be gathered from an inertly transferred cycled LFP cathode (Figure 6). This includes insights into porosity, electrode particle degradation, delamination, cracking, and chemical contamination.
Such detailed information aids in understanding the inner properties of the cathode, enabling the evaluation of battery material degradation and its root causes, such as mechanical damage, Li dendrite growth, or parasitic chemical reactions.
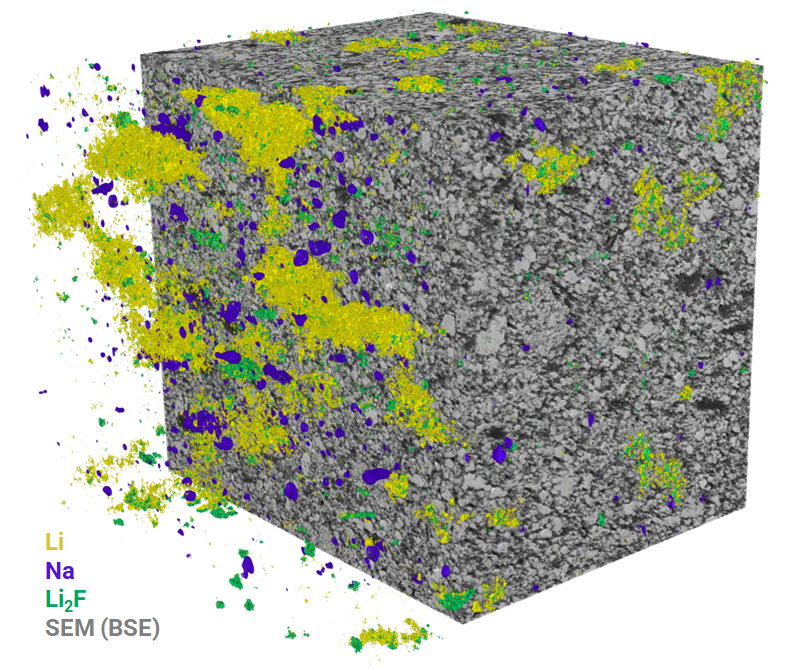
Figure 6. 3D ToF-SIMS data visualization of a cycled LFP cathode overlayed with 3D SEM-BSE imaging dataset. The shown volume has a size of 60 x 60 x 60 µm3. Image Credit: TESCAN Group
References
- J.A. Whitby et al., Advances in Materials Science and Engineering [Online] 2012, 180437 (2012). https://doi.org/10.1155/2012/431297
- D. Alberts et al., Instrumentation Science & Technology 42,4, (2014), p. 432-445. doi:10.1080/10739149.2013.878843.
- T. Sui et.al., Nano Energy 17 (2015), p. 254-260. https://doi.org/10.1016/j.nanoen.2015.08.013
- Bessette S. et al., Scientific Reports [Online] 8, 17575 (2018), https://doi.org/10.1038/s41598-018-33608-3
- Hovington, P. et al., Scanning 38 (2016), p. 571–578. https://doi.org/10.1002/sca.21302
- Szakal, Christopher et al., Analytical chemistry 83,4 (2011), p. 1207-1213. doi:10.1021/ac1030607
- TESCAN 3D Analysis Suite, https://www.tescan.com/product/tescan-3d-volume-analysis/

This information has been sourced, reviewed and adapted from materials provided by TESCAN Group.
For more information on this source, please visit TESCAN Group.