Dispersion is an important part of particle characterization technique, and hence obtaining a stable and reproducible dispersion state is critical for method development. Surfactants, ultrasound and mechanical stirring are used for dispersion to measure particles present in liquids.
This article describes the application of Mastersizer’s Hydro Sight accessory (Figure 1) from Malvern Panalytical to visualize the dispersion of the sample for method development.
This product helps observing the presence of agglomerates in samples and how they have been dispersed into primary particles by stirring and ultrasound.

Figure 1. Mastersizer 3000 with Hydro Sight and Hydro EV.
Experimental Procedure
Sample Preparation
Powdered toner is used as a sample. The experiment aims to disperse the toner sample in de-ionized water for particle size measurement using the Mastersizer 3000, and visualizing the sample dispersion process using the Hydro Sight accessory.
The sample preparation involved pre-dispersion of the sample in de-ionized water containing surfactant. The resultant solution was then introduced to Hydro EV for dispersion using the de-ionized water. The Hydro Sight accessory was fixed between the Mastersizer 3000 and the Hydro EV, yielding the images of the dispersion process while the process was quantified by the Mastersizer.
Dispersion Process
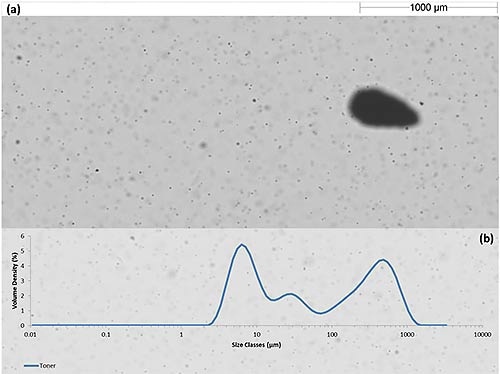
The sample is dispersed by the pump and stirrer in the Hydro EV. Hydro Sight images initially show some large agglomerates, while Mastersizer 3000 measures a wide particle size distribution, as shown in Figure 2.

Figure 2. (a) Hydro Sight Image of toner in an agglomerated state (b) Mastersizer 3000 particle size distribution of agglomerated toner.
Some loosely bound agglomerates tend to separate owing to the dispersion energy produced during stirring. It is possible to track the reducing particle size and increasing obscuration during the dispersion of agglomerates into primary particles, using the Mastersizer 3000 software. The Hydro Sight Dispersion Index (DI) and
Relative Standard Deviation (RSD) can also be used to follow the process of sample dispersion.
Measurement of Dispersion Index and Relative Standard Deviation
The DI is the quantification of disorder in an individual image frame. A frame with a large number of particles has high DI due to high degree of disorder. Similarly, a frame showing fewer particles is said to have low DI. Therefore, changes in DI value represent the dispersion change. For instance, upon attaining full dispersion, the size distribution and variability of the sample reduce, and DI becomes more stable.
The DI was expected to increase with the dispersion of agglomerates into primary particles and with the increase in the number of particles per frame. Moreover, the particle size distribution becomes narrower when full dispersion occurs, resulting in the reduction of the RSD of the dispersion index.
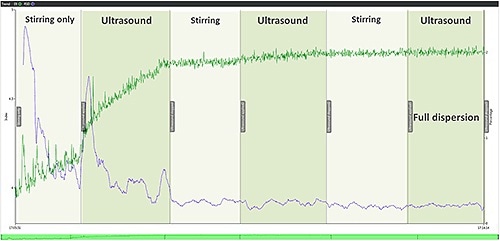
A graph showing the DI and RSD of toner sample during the dispersion process is illustrated in Figure 3. Stirring of sample and dispersion of loosely bound agglomerates increase the DI and number of particles per frame. Change in the sample state is indicated by a sharp rise in the RSD.
The DI increases significantly with the application of ultrasound, indicating further dispersion of the sample. Further increase in DI at small level takes place with the second application of ultrasound. However, no change in DI occurs at the third level, which indicates full dispersion and confirmation of the RSD stability.

Figure 3. Following the dispersion trend using the DI and RSD.
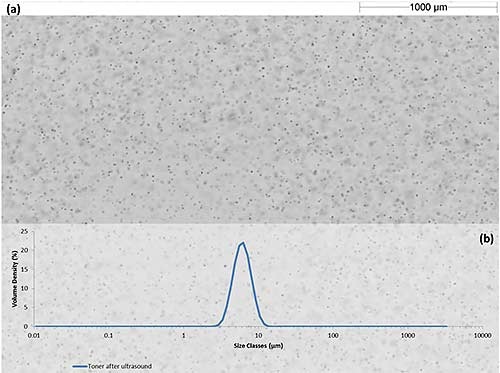
The Hydro Sight images show distribution of fine particles as shown in Figure 4, indicating full dispersion of the sample. Also, the Mastersizer 3000 reports a narrow primary particle distribution with 6 µm median size.

Figure 4. Hydro Sight Image of the dispersed toner sample (b) Mastersizer 3000 particle size distribution.
Conclusion
The article demonstrated the application of the Mastersizer’s Hydro Sight accessory for the visualization of dispersion state of a sample. The dispersion process was also studied through the Hydro Sight’s relative standard deviation and dispersion index.
The Hydro Sight images of the beginning, middle and end of the dispersion process of the toner sample are shown in the Figure 5. This additional data helps in gaining thorough knowledge of dispersion and developing robust techniques to perform laser diffraction measurements.

Figure 5. Hydro Sight Images from the beginning, middle and end of the dispersion process.

This information has been sourced, reviewed and adapted from materials provided by Malvern Panalytical.
For more information on this source, please visit Malvern Panalytical.