The commercial significance of carbon black will be unanimously acknowledged among conference attendees. It is utilized as an abrasion-resistant filler in the production of tires and in the manufacture of a number of additional rubber materials. Moreover, carbon black is utilized as a pigment in lacquers and coatings, printing inks, plastics and tinting blacks1.
As the particle size distribution (PSD) among aggregates of carbon black is powerfully correlative with the mechanical and thermal characteristics of dispersions2, the measurement of a carbon black PSD is a key component of quality control. The normal size range for non-agglomerated carbon black spans 10 nm to over 500 nm. Despite often being unimodal, except for mixtures, the standard carbon black PSD is broad, and usually covers more than one decade (and sometimes more than two) in size.
Due to the small sizes involved and the width of standard distribution, a disc centrifuge photosedimentometer (DCP) has been the favored instrument for over 25 years3. It is a rugged instrument, the theory of which has been well developed. As long as all corrections are performed, the precision of the DCP is unrivaled. After a short review of the theory, which will include the significance of the light scattering correction, the results on ASTM reference materials will be examined.
Theory: Stokes’ Law in a Centrifuge
The theory was introduced during the previous conference held in Japan and a summary is presented herein. It is also summarized in the literature4,6. There are two techniques utilized with a DCP: the line start and the homogeneous start. This article will solely focus on the line start. With this method, a small volume of the dispersion is injected onto the meniscus of a hollow, rotating disc filled with liquid.
The liquid is known as the spin fluid. Ordinarily, it holds a gradient to impede hydrodynamic instabilities, surfactants to match those in the dispersion and an extremely thin layer of a low vapor pressure liquid to inhibit thermal inversions and evaporative cooling.
Following injection, assuming the particle density is greater than the liquid density, all of the particles of various sizes simultaneously start to sediment radially outward. This line start technique offers the highest resolution. An equation of motion is included for a particle of mass mp, diameter Dp, and density ρp moving radially outward in a liquid of viscosity ηf and density ρf, whilst the disc spins with an angular velocity of ω. After accounting for the buoyancy and frictional terms, and assuming a steady-state solution, the result is:

Here t represents the required time for the particle to travel from the meniscus, with radial distance S, to the detector, with radial distance rd. S is simply calculated using the volume of the injected spin fluid and the internal dimensions of the disc cavity.
The density difference between the fluid and the particle is provided by ∆ρ = ρp - ρf. For ∆ρ > 0, which is the case for carbon black in water, the particles sediment radially outward and the detector is located close to the internal perimeter of the disc. For ∆ρ < 0, which is the case for oil droplets in water, the particles sediment radially inward and the detector is located just underneath the meniscus.
In this instance, the homogeneous start technique is utilized. The measured time at which particles intersect the detector provides the particle size via Stokes’ Law. To finalize the PSD calculation, the amount of material at that time is needed. This is computed from the turbidity τ, which is acquired from the measured voltages with and without particles.
To acquire the volume distribution, corrections need to be implemented. One such correction, the extinction correction, is worthy of repetition, as it was comprehensively neglected in numerous earlier DCP investigations.
The differential volume distribution (equivalent to the differential weight distribution assuming every particle embodies identical density) is provided by:

Here C represents a constant for a fixed detector position. Qext represents the extinction efficiency, the calculation of which is undertaken using Mie scattering theory, given the wavelength of the light (650 nm for a BIDCP), the size of the particle (measured using Stokes’ Law, above), and the refractive index of the particle and liquid4.
While there are moderate variations5 among the refractive index of carbon blacks, an acceptable mean value for particle sizing is n = 1.84 - 0.85i. Figure 1 displays the extinction efficiency versus particle diameter from 0 to 2 microns. The calculations are analyzed in a previous publication4.
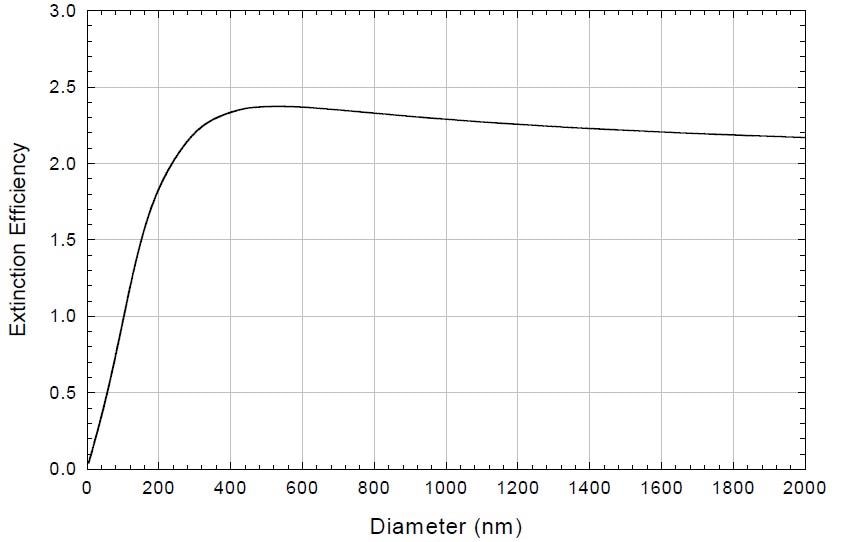
Figure 1. Extinction correction for carbon black
One can see the linear increase from zero to about 200 nm, and also that the curve asymptotically approaches a flat line, with a limiting value of 2, as the size increases. This represents the limiting value predicted by Fraunhofer diffraction theory, also called forward angle light scattering theory.
In this size range, no refractive index is needed and instruments based on Fraunhofer diffraction are appropriate. Under this range, where the extinction correction is needed for precision, the particle refractive index is necessitated and Fraunhofer theory is no longer applicable. The relationship between the volume distribution and turbidity, Qext is provided by6:

Here the number-weighted, differential PSD is dN/dD, the volume-weighted differential PSD is dV/dD (also equal to the differential weight distribution when all the particles embody identical density), and the factors c and c’ represent normalization constants which drop out of the eventual analysis. The number- and volume-weighted cumulative PSDs are acquired by integrating dN/dD and dV/dD, respectively. This equation holds for a fixed detector position and was acquired following integration over a finite detector slit width.
Prior to integration, the surface area-weighted size distribution is proportional to τ/Qext . Treasure7 was the first to indicate this. Following integration, the volume-weighted size distribution, dV/dD, is proportional to τ/Qext . As carbon blacks are neither monodisperse nor homogeneous spheres, it is not possible to experimentally prove that the theory is correct utilizing carbon black.
Nevertheless, work with both polystyrene latex and BCR66 (quartz powder) have demonstrated the strong concordance of theory and experiment4, utilizing both the Treasure correction and the appropriate extinction efficiency.
Sample Preparation and Centrifuge Run Conditions
Around 10 mg of the carbon black powder is mixed with 2 mL of 100% ethanol in a 20 mL, screw-cap, dilution vial. The suspension undergoes sonication in a 30 mW sonic bath for 5 minutes to dampen the sample. Cooling of the capped vial requires it to be inserted into an ice-water bath for 3 minutes.
After it has been cooled, it undergoes further sonication while 6 mL of a 0.1 vol% TritonX-100 (DuPont) aqueous solution is slowly added to the suspension to scatter the particles. Nevertheless, to completely disperse the more firmly bound agglomerates, robust mechanical energy is still required. The consequent 8 mL suspension undergoes sonication with a 375-watt sonic probe at 40% power, with a 50% duty cycle, for 10 minutes while encompassed by an ice bath to preclude boiling and evaporation.
A pipette is utilized to extract the suspension, ensuring not to withdraw any undispersed particles attached to the glass walls of the original vial. The contents of the pipette are vacated into a clean, 20 mL vial. Lastly, the suspension undergoes de-gassing for five minutes utilizing the de-gas mode of a sonic bath (not constant sonic mode).
While capped, warming up to room temperature is permitted. For each quantification, around 0.2 mL of this suspension is injected into the centrifuge. The quantifications were undertaken with a Brookhaven Instruments BI-DCP, disc centrifuge photosedimentometer, utilizing the following procedures.
About 0.2 mL of 100% ethanol is injected into the non-spinning disc, acting as a buffer layer which rises through the spin fluid. The disc is subsequently spun at 8,000 rpm. Following this, 15 mL of a 0.1 vol% TritonX-100 aqueous solution, the spin fluid, is immediately injected into the spinning disc, proceeded immediately by the injection of around 0.1 mL of 100% dodecane to inhibit evaporative cooling.
Preparation of the spin fluid and dodecane liquids and syringes before the ethanol injection is key, as this will preclude evaporation and thermal gradients. A flat voltage versus time response after a couple of minutes enables the system to reach thermal equilibrium.
Subsequently, around 0.2 mL of the carbon black suspension detailed in the first paragraph is injected. A normal run time lasts for around 45 minutes. Although not obligatory, injecting NIST-traceable, narrow latex standards, both before and after each of the carbon black samples, was found to be useful as a way of verifying both gradient and thermal stability, as well as the temperature inside the disc. Stability was outstanding and it was possible to make multiple injections over the same gradient for up to four hours.
Results
The volume-weighted, cumulative undersize and differential PSD for ASTM carbon black reference material A4 are presented in Figure 2 with and without the extinction correction. The uncorrected distribution is shifted to larger sizes. The d50 is shifted by 10%, from 96.6 nm with the full light scattering correction to 106.5 nm with no correction.
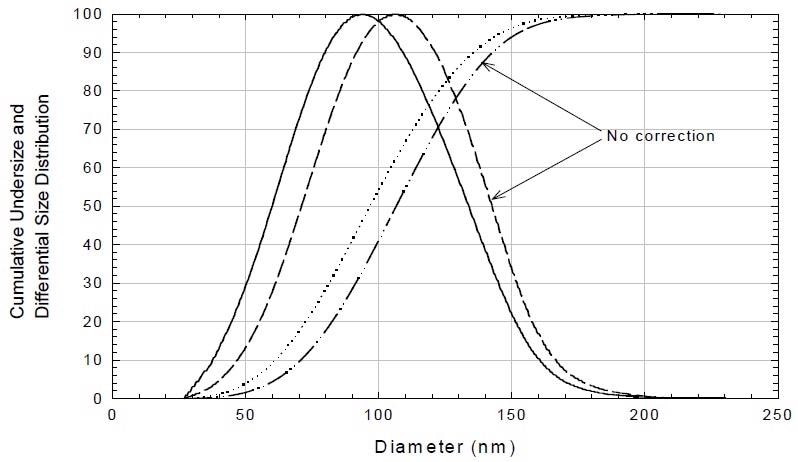
Figure 2. Effect of light scattering correction.
The volume-weighted, cumulative undersize and differential PSDs for ASTM A4, B4, C4, D4, E4, and F4, including the light scattering and Treasure corrections, are presented in Figures 3 and 4, respectively.
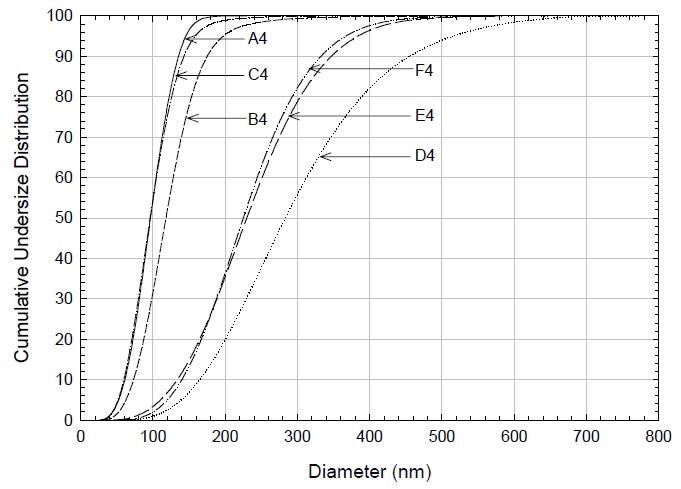
Figure 3. Volume-weighted, cumulative undersize distribution.
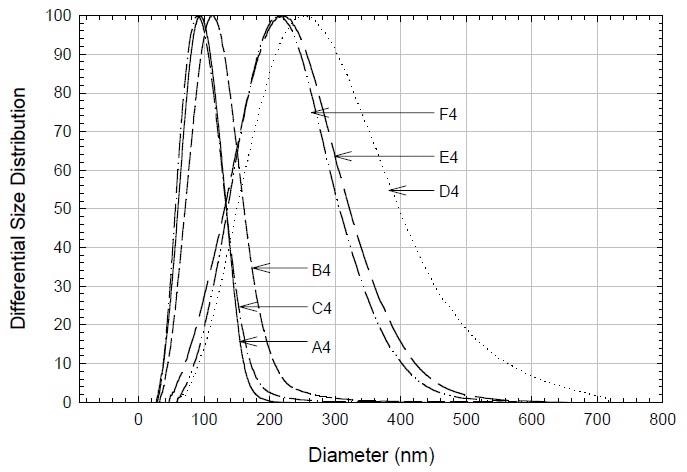
Figure 4. Volume-weighted, differential particle size distribution.
Table I displays the 10th, 50th, and 90th percentile diameters by volume for these six ASTM reference materials. The span defined as

is one of many possible measures of relative width for a unimodal distribution.
Table 1. ASTM Reference Materials: Particle Size in nanometers
| ASTM Name |
d10 (nm) |
d50 (nm) |
d90 (nm) |
Span |
| A4 |
61.1 |
96.6 |
136 |
0.775 |
| B4 |
73.2 |
118 |
175 |
0.863 |
| C4 |
59.5 |
96.5 |
143 |
0.865 |
| D4 |
165 |
283 |
455 |
1.025 |
| E4 |
134 |
230 |
347 |
0.926 |
| F4 |
140 |
225 |
332 |
0.853 |
Six repeats of A4 yielded a 95% confidence limit of 1.5 nm on d50. This 1.5% reproducibility is also a reasonable estimate for each of the other figures in the table. This figure is utilized to direct the remainder of the comparison.
The six samples can be sub-divided into two groups: small sizes (A4, B4, C4) and large sizes (D4, E4, F4). As measured by the span, the six samples embody a mean relative breadth of 0.88, with only a 16% deviation above and below this value incorporating all six samples.
Nevertheless, there are important divergences at the 1.5% reproducibility level. Sample D4 is the widest, sample A4 is the narrowest, while samples B4, C4, and F4 embody, more or less, the same relative breadths. Although d10 and d50 of samples A4 and C4 are equal within the random error of the measurements, d90 of sample C4 is larger. This takes into account sample C4’s greater relative width.
While d50 of samples E4 and F4 are equal within the random error of the measurement, this is not the case for d10 and d90, with sample E4 spread to moderately lower and moderately higher sizes than F4. This takes into account sample E4’s greater relative width. As carbon blacks typically undergo agglomeration, the sample preparation requires dispersion using a sonic probe.
An obvious question would be whether or not the sample preparation is adequate to disperse agglomerates. Results are presented in Figure 5 on sample A4 prepared with the normal and four times the normal duration of sonic energy. The results are identical within the random error of repeated measurements.
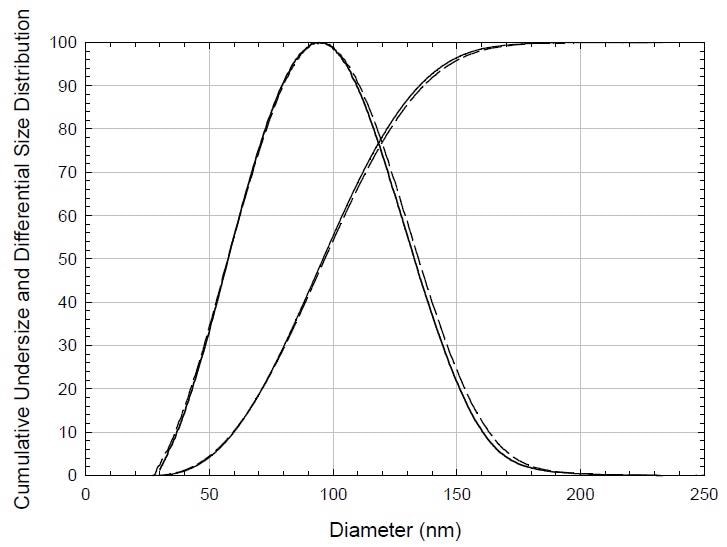
Figure 5. Different durations of sonic (probe) energy to test sample preparation on A4.
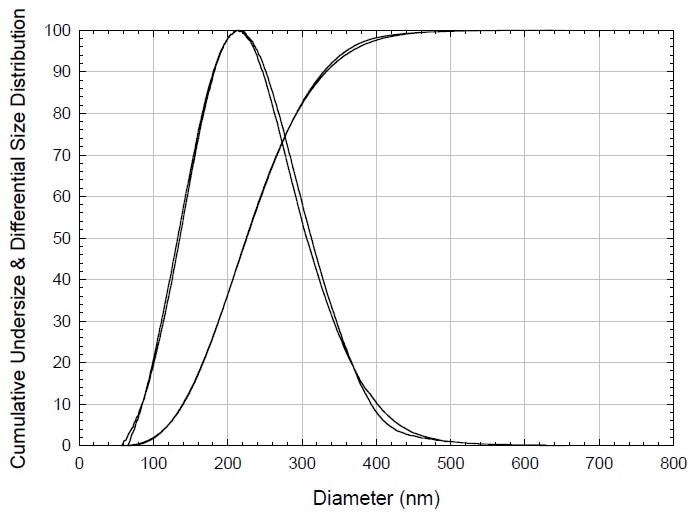
Figure 6. Stability of sample F4 one year later.
The results displayed here were actually calculated in February of 1999, following the December 1998 meeting in Japan. Testing the stability of the dispersions required new measurements of sample E4 and F4 in January of 2000, with only moderate sonication (30-40 W, 3-5 minutes) applied.
These were not newly prepared samples but were actually the same suspensions that had been prepared a year earlier, and which had been left sitting in the laboratory. The agreement is within the 1.5% random error of the measurement for 10th, 50th, and 90th percentiles of the volume-weighted, cumulative undersize distributions for both E4 and F4.
However, the 90th percentile for E4 was 4.4% less after a year had elapsed. The volume-weighted, cumulative undersize and differential PSDs are displayed for F4 in Figure 6. The agreement is superb. It should be noted that all scales are linear. The majority of size distribution analyses are submitted on logarithmic scales and this often disguises weak resolution.
Discussion
For precise results on carbon blacks, a light scattering correction in the form of Qext is needed to transform turbidity-weighted centrifuge results into volume-weighted PSD results, when the particle size is lower than a few microns. Similarly, a light scattering correction is also needed for any additional type of experiment in which light is utilized to identify the number of particles.
This is applicable to column hydrodynamic fractionation, field-flow fractionation, dynamic light scattering and multiple categories of high angle light scattering, such as the extension of Fraunhofer diffraction into the colloidal size range.
It would be erroneous to presume that, over the entire range of interest for carbon blacks the correction is linear. The optimal technique is to utilize the exact correction, as demonstrated herein. The acceptability of the sample preparation approach manifests in two ways. Firstly, an increase in the duration of sonic energy to disperse the agglomerates8 yielded identical outcomes, which suggested that the technique is adequate as it stands.
Furthermore, samples which were administered one year later, after having sat in the laboratory for the interim period, required only moderate bath sonication to guarantee reproducibility within the random error of the measurement. Tables of the volume-weighted, cumulative undersize and differential particle size distributions for these ASTM reference materials are can be obtained from the authors.
References and Further Reading
- Voll, M. & Kleinschmit, P., “Black Pigments (Carbon Black)”, in Industrial Inorganic Pigments, edited by G. Buxbaum, VCH Publishers, New York, 1993.
- Patel, A.C. & Lee, K.W., “Characterizing Carbon Black Aggregate via Dynamic and Performance Properties”, Elastomerics, Communication Channels Inc., Atlanta, March 1990.
- Redman, E., Heckman, F.A., & Connolly, J.E., Rubber Chemical Technology, 51:1000, 1977.
- Weiner, B.B., Fairhurst, D., & Tscharnuter, W.W., “Particle Size Analysis with a Disc Centrifuge: Importance of the Extinction Correction”, in Particle Size Distribution II: Assessment and Characterization, edited by T. Provder, ACS Symposium Series 472, American Chemical Society, Washington D.C., 1991, Chapter 12.
- Medalia, A.I. & Richards, L.W., Journal of Colloid and Interface Science, 1972, 40, 233.
- Devon, M.J., Provder, T., & Rudin, A., “Measurement of Particle Size Distribution with a Disc Centrifuge”, in Particle Size Distribution II: Assessment and Characterization, edited by T. Provder, ACS Symposium Series 472, American Chemical Society, Washington D.C., 1991, Chapter 9.
- Treasure, C.R.G., Whiting and Industrial Powder Research Council, Welwyn, U.K., Tech. Paper No. 50, 1964. See reference 5 above for a more modern development of the Treasure correction.
- The authors distinguish between primary particles, aggregates (strongly bonded), and agglomerates (weakly bonded: edges and corners).

This information has been sourced, reviewed and adapted from materials provided by Brookhaven Instrument Corporation.
For more information on this source, please visit Brookhaven Instrument Corporation.