Sponsored by EDAXReviewed by Olivia FrostFeb 6 2023
During a phase transformation, a single grain in the original microstructure of a material may be transformed into multiple different crystallographic variants. The association between the parent grain orientation and the child variants is referred to as the orientation relationship.
In the case of austenite (γ, fcc) to ferrite (α, bcc) transformation in iron, as depicted in Figure 1, if the Nishiyama-Wasserman orientation relationship is assumed, with {111}fcc planes parallel to {110}bcc planes and <11-2>fcc directions aligned with <110>bcc, it can be expected that a parent grain will transform into as many as 12 distinct child variants (in this example, six variants are present).
Methodology
The challenge in this method is reconstructing the pre-transformation microstructure from the measured post-transformation microstructure. Over the years, various methods have been proposed to tackle this challenge. OIM Analysis™ v8.6 has adopted a technique proposed by Ranger et al.
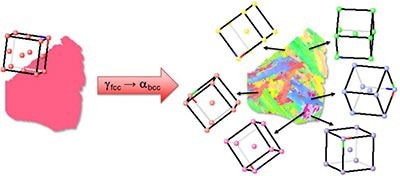
Figure 1. Schematic of the parent austenite phase and six possible variants to the child ferrite phase orientations. Image Credit: EDAX.
Figure 2 highlights an example of reconstruction for low alloy steel. (EBSD measurements are courtesy of Matt Merwin, US Steel Research and Technology Center).
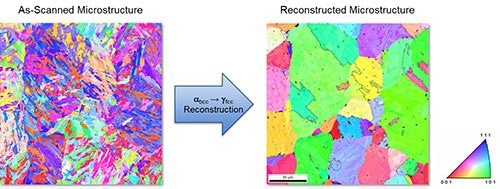
Figure 2. As-scanned and reconstructed parent grain microstructure. Image Credit: EDAX.
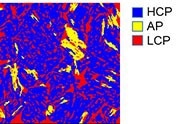
Figure 3. Classification of measured data into candidate parent orientations. Image Credit: EDAX.
The method adopted by OIM Analysis™ v8.6 can be broken down into the following steps:
- For each domain - grain - in the as-scanned microstructure, a list of all possible candidate parents is calculated based on a user-specified orientation relationship.
- Based on the proportion of surrounding domains with matching parents in their candidate parent lists, the most likely parent for each child variant is found and designated as a High Confidence Parent (HCP), Ambiguous Parent (AP), or Low Confidence Parent (LCP). Figure 3 depicts an illustration of this classification.
- The HCPs are grouped and expanded to include neighboring APs.
- The analysis is extended to the second nearest neighbors for LCPs and is repeated in step 2.
- The process is repeated using the 2nd order HCPs and APs in step 3.
Case Study: hcp ↔ bcc Phase Transformation in Cobalt
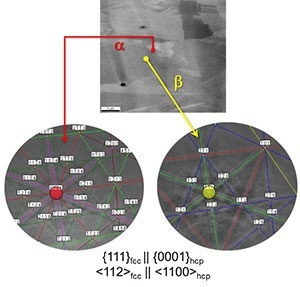
Figure 4. EBSD patterns from HCP and BCC cobalt collected via in-situ heating. Image Credit: EDAX.
The transition temperature between Hexagonal-Closed-Pack (HCP) and Body-Centered Cubic (BCC) phases in iron occurs at 422 °C. Figure 4 illustrates the orientation relationship between the two phases.
When in-situ measurements are taken, it is possible to capture the microstructure while it is only partially transformed, enabling the orientation relationship to be directly observed in the scan data and EBSD patterns.
In the scanning electron microscope, a sample was put on a heating stage, and Electron Backscatter Diffraction (EBSD) observations were made in situ at temperatures both above and below the transition point.
Figure 5 displays the orientation (IPF) and phase maps at temperatures above and below the transition temperature.
These in-situ measurements make it possible to compare the reconstructed pre-transformation microstructure to the experimental one, thereby confirming the quality of the reconstruction process.
The differences between the two are relatively minor, and the reconstruction is considered to be of sufficient quality to capture the grain size in the pre-transformation microstructure.
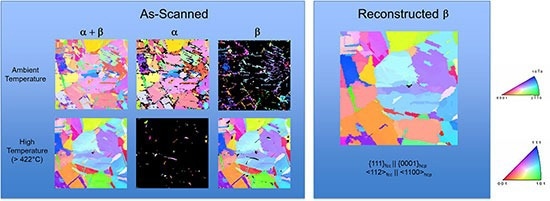
Figure 5. EBSD IPF orientation maps at ambient and high temperature collected from the Co sample, and reconstructed parent Beta grains developed from ambient temperature measurements. Image Credit: EDAX.
References
- Humbert, M., Wagner, F., Moustahfid, H. and Esling, C. (1995) Determination of the orientation of a parent β grain from the orientations of the inherited α plates in the phase transformation from body-centred cubic to hexagonal close packed. Journal of applied crystallography 28: 571-576.
- Glavicic, M.G., Kobryn, P.A., Bieler, T.R. and Semiatin, S.L. (2003) An automated method to determine the orientation of the high-temperature beta phase from measured EBSD data for the low-temperature alpha-phase in Ti–6Al–4V. Materials Science and Engineering: A 351: 258-264.
- Cayron, C., Artaud, B. and Briottet, L. (2006) Reconstruction of parent grains from EBSD data. Materials characterization 57: 386-401.
- Krishna, K.M., Tripathi, P., Hiwarkar, V.D., Pant, P., Samajdar, I., Srivastava, D. and Dey, G.K. (2010) Automated reconstruction of pre-transformation microstructures in zirconium. Scripta Materialia 62: 391-394.
- Germain, L., Gey, N., Mercier, R., Blaineau, P. and Humbert, M. (2012) An advanced approach to reconstructing parent orientation maps in the case of approximate orientation relations: Application to steels. Acta Materialia 60: 4551-4562.
- Miyamoto, G., Iwata, N., Takayama, N. and Furuhara, T. (2010) Mapping the parent austenite orientation reconstructed from the orientation of martensite by EBSD and its application to ausformed martensite. Acta Materialia 58: 6393-6403.
- Ranger, C., Tari, V., Farjami, S., Merwin, M.J., Germain, L. and Rollett, A. (2018) Austenite Reconstruction Elucidates Prior Grain Size Dependence of Toughness in a Low Alloy Steel. Metallurgical and Materials Transactions A 49: 4521-4535.
- Brust, A.F., Payton, E.J., Hobbs, T.J. and Niezgoda, S.R. (2019) Application of the Maximum Flow–Minimum Cut Algorithm to Segmentation and Clustering of Materials Datasets. Microscopy and Microanalysis 25: 924-941.

This information has been sourced, reviewed and adapted from materials provided by EDAX.
For more information on this source, please visit EDAX.