A better understanding of powder behavior at the time of preparation, transfer, and filling of dies is crucial in powder metallurgy. This is because every step has an impact on the quality of the finished component. To achieve high quality and productivity during manufacture, both process and powder properties should be compatible.
This article analyzes the dynamic flow, bulk, and shear characteristics of four different materials and demonstrates how the effectiveness of die filling corresponds well with several powder properties.
Therefore, the availability of precise data about the bulk and flow properties of powders enables consistent estimation of the efficiency of die filling, and thus prevents the need for the more common “trial and error” method.
Introduction
The following stages are used for manufacturing components made from metal powders:
- Die filling—Powder is discharged from a feed shoe and allowed to drop into the die cavity
- Powder transfer—Powder is shifted into the die and subjected to an array of tool motions to create a compact product that approaches the ultimate shape
- Compaction—Powder in the die is compressed to form a green body
- Ejection—Powder is expelled from the die following compaction
- Sintering—Following compaction, the green body is sintered in a reducing atmosphere
- The component is machined or sized to make sure that dimensional tolerance is sustained
In particular, the stages comprising compaction, ejection, and sintering have a considerable effect on the properties of the final components. A better understanding of the behavior of powders during preparation, die filling, and powder transfer is very crucial. This is because the density distribution and packing structure of these powders may affect the later stages, and influence the integrity of the finished components.
Powder Flowability and Die Filling
Numerous experimental methods have been used to quantify powder flowability with respect to die filling. These methods include the following:
- Angle of repose
- Hall flowmeter and Flodex flowmeter (mass flow rate or time needed to discharge via an opening)
- Hausner ratio and Carr index (poured and tapped bulk density)
- Shear cell (quantifies the yield strength of a consolidated bulk solid)
While the aforementioned methods may prove useful in certain process environments, none can predict powder behavior at the time of die filling.
Factors Influencing Powder Behavior
Powder behavior is complex. It is influenced by a combination of physical properties and the characteristics of the processing equipment, and powder flowability cannot be expressed adequately as a single value or index. Die filling is a dynamic process, so any powder characterization methods used should closely reflect the real industrial sitation.
Case Study—Die Filling Behavior of Tungsten, Aluminum, and Glass Beads
This article investigates the die filling behavior, or die filling ratio, of aluminum, tungsten, and two other kinds of glass beads of varied nominal size. The FT4 Powder Rheometer from Freeman Technology was used to characterize the dynamic flow, bulk, and shear properties.
Experimental Approach
Particle Size and Morphology
A Mastersizer 2000 from Malvern Instruments based in Malvern, United Kingdom, was used to determine the particle size distribution for every material. The morphology of the particles was also defined using a JEOL 6340F Scanning Electron Microscope (SEM). Table 1 shows the results of the experiment.
Table 1. General powder properties. Source: Freeman Technology Ltd
| Material |
Materials/Powder Description |
D50 (µm) |
Shape |
| (a) |
GL Glass beads |
174 |
Spherical |
| (b) |
GS Glass beads |
68 |
Spherical |
| (c) |
Granules Aluminium Powder |
134 |
Irregular |
| (d) |
Tungsten powder |
4 |
Angular |
Conditioning Powders
To achieve repeatable data, powders should exhibit a uniform packing state. When a certain powder is received for testing, it has a unique history that has been affected by various factors, like consolidation, aeration, segregation, vibration, or caking. To remove this history, “conditioning” is carried out by gently displacing the entire powder sample, loosening and slightly aerating it into a reproducible and homogenized state.
Before measurement, all samples meant for shear, bulk, and dynamic testing were conditioned and “normalized” using the FT4 Powder Rheometer.
Measuring Powder Flowability
The FT4 Powder Rheometer from Freeman Technology is a universal powder tester. Accessories, like shear heads, pistons, and blades, can be rotated and concurrently shifted axially into a powder sample, while the rotational force and axial force are quantified. Both axes feature several control modes, such as torque, force, and velocity. Typical dynamic tests, shear testing, and aeration testing are automated without the involvement of operators, aside from sample preparation.
A 48 mm diameter blade was used to perform dynamic testing, and a 160 mL powder sample was transferred in a 50 mm bore, borosilicate test vessel (see Figures 1a and 1b). Using an 85 mL sample, the entire shear testing was carried out with an automated, 18 segment, 48 mm diameter rotational shear cell accessory (see Figure 1c).
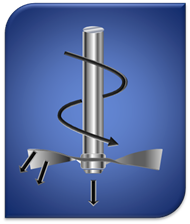
Figure 1a. Downwards testing mode showing bulldozing action along the entire blade length. Image Credit: Freeman Technology Ltd
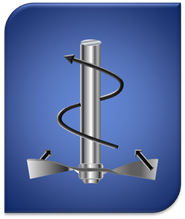
Figure 1b. Upwards testing—shearing with minimal consolidation. Image Credit: Freeman Technology Ltd
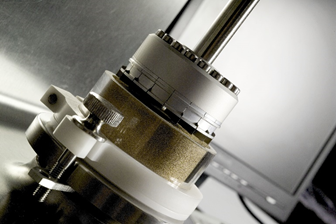
Figure 1c. The shear cell above the sample vessel. Image Credit: Freeman Technology Ltd
Die Filling Rig
To simulate commercially available die filling processes (see Figure 2), a model die filling rig was specifically developed. It consists of a stationary die and a motorized unit which drives the show at a steady velocity from 50 to 300 mm/s.
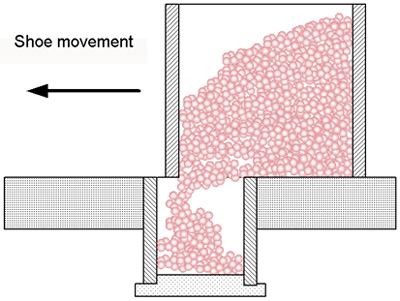
Figure 2. Schematic drawing for die filling process. Image Credit: Freeman Technology Ltd
The feed shoe used in this analysis had a cylindrical shape, with a diameter of 50 mm and a fixed volume of 160 mL. The cylinder die had a diameter of 25 mm and a volume of 10 mL.
Experiments were performed in air at shoe velocities ranging from 50 to 250 mm/second. The FT4 Powder Rheometer was used to condition 160 mL samples, which were carefully shifted to the rig for translation across the die. The mass shifted to the die was subsequently quantified to establish the filling ratio. This process was repeated three times, and during each process, a freshly conditioned powder sample was used.
Results and Discussion
Powder Flowability
The most significant material properties have been summarized in Table 2, and these properties are further discussed in this section.
Table 2. Powder flow properties characterized under a different status. Source: Freeman Technology Ltd
| Measurements |
Glass GL |
Glass GS |
Aluminum |
Tungsten |
| Basic Flowability Energy, BFE (mJ) |
1431 |
899 |
3300 |
5964 |
| Stability Index, SI |
1.03 |
0.97 |
1.25 |
1.10 |
| Flow Rate Index, FRI |
1.04 |
1.02 |
1.48 |
1.40 |
| Conditioned Bulk Density, CBD (g/ml) |
1.44 |
1.46 |
1.24 |
4.17 |
| Bulk Density, consolidated by 20 taps, (g/ml) |
1.50 |
1.49 |
1.34 |
4.97 |
| Specific Energy, SE (mJ/g) |
3.36 |
2.36 |
4.40 |
6.70 |
| Aeration Ratio, AR |
49.2 |
56.3 |
171.5 |
26.1 |
Pressure Drop across the powder bed
at 2 mm/s air velocity, PD15 (mbar) |
0.82 |
5.20 |
1.40 |
15.3 |
Consolidation Index, CI20Taps - factor by
which flow energy increases relative to BFE |
1.31 |
1.11 |
1.43 |
2.32 |
| Volume change -20 taps (%) |
4.0 |
2.0 |
7.5 |
16.1 |
Volume change -15 kPa direct pressure,
Compressibility (%) |
2.03 |
2.46 |
3.50 |
11.1 |
| Shear Stress, t2 (kPa) |
1.0 |
0.74 |
1.57 |
1.64 |
| Shear Stress, t1 (kPa) |
0.52 |
0.39 |
0.88 |
1.02 |
| Unconfined Yield Strength, UYS (kPa) |
0.28 |
0.13 |
0.45 |
1.09 |
| Angle of Internal Friction (°) |
23.9 |
18.7 |
35.7 |
34.0 |
| Cohesion, Co (Pa) |
90 |
46 |
120 |
297 |
| Flow Function, FFc |
14.0 |
29.3 |
11.6 |
5.53 |
Specific Energy (SE)
Specific Energy (SE) is a measure of how easily a powder will flow in an unconfined or low stress environment. It is calculated from the energy needed to estabish a particular flow pattern in a conditioned, precise volume of powder. During measurement, this flow patter is an upward clockwise motion of the blade (see Figure 1b), generating gentle lifting and low stress flow. SE is calculated from the work done in moving the blade through the powder from the bottom to the top of the vessel (upward traverse). Gravity dominates in this test, so to compensate for varying bulk densities the flow energy is expressed as Specific Energy, mK/g.
SE depends primarily on the shear forces acting between particles. Cohesion is often the most influential property in low stress environments. Sample GS has the lowest SE indicating it flows most readily in a low stress, conditioned state. Tungsten has the highest SE suggesting it behaves most cohesively. Interestingly, GL has a higher SE than GS, indicating higher cohesion.
Basic Flowability Energy (BFE)
In such conventional dynamic tests, a formerly conditioned powder was consolidated through a bulldozing blade action (see Figure 1a) that pushed the powder in a downward direction towards the base of the containing vessel.
The Basic Flowability Energy (BFE) value is a major parameter and is extremely sensitive and differentiating with respect to slight variations in flow properties. As indicated in Table 2, results differed from 5964 mJ in tungsten to 899 mJ in Glass GS.
Aeration
The flow properties of a powder are considerably affected by the presence or absence of air; the air is naturally added when a powder is shifted freely. When a powder is subjected to aeration, minimal energy is usually needed to shift it. The Aeration Ratio (AR) describes the reduction in flow energy.
In cohesive powders, air cannot permeate through the powder bulk and, as a result, rat-holes or channels are formed. Therefore, the resulting change in energy is rather small. Less cohesive powders allow air to permeate the whole bulk, leading to a huge reduction in energy. In certain cases, almost all particles separate, causing the bed to fluidize. The susceptibility of a powder to aeration correlates well to its performance in a gravity feed system and for procedures like volumetric filling.
During aeration, the four powders act quite differently when exposed to the same range of air velocities (refer to Figure 3). The aluminum, GL, and GS glass beads fluidize above a specific air velocity. Because of its permeability, the GL sample requires the highest velocity, releasing air rapidly and needing considerable air flow to separate the particles.
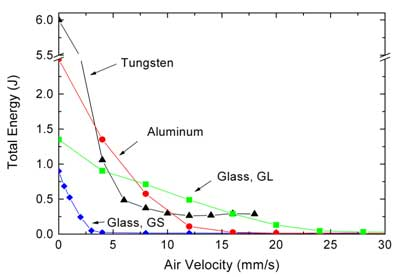
Figure 3. How flow energy varies as a function of air velocity. Image Credit: Freeman Technology Ltd
The smaller glass beads, GS, have six times lower permeability, which enables fluidization at comparatively low air velocity. Therefore, when compared to GL, a slight amount of entrained air will considerably enhance the flowability of GS. But GL will quickly discharge a huge amount of entrained air.
Moreover, the aluminum powder has high permeability, needing high air velocity to fluidize. Tungsten does not fluidize because of its poor permeability, as illustrated by the high flow energy requirement in Figure 3. Close bonding of the tiny tungsten particles renders the bed cohesive, and the injected air forms channels to escape.
Consolidation—How it Affects Flow Energy
The loss of entrained air and closer packing indicates that consolidated or compacted powders are less likely to flow freely under the influence of gravity. After subjecting all the four powders to 20 taps, their consolidation was determined. Several processes (such as die filling) impose vibration, and the susceptibility of a powder to this vibration is significant. The standard dynamic test was employed (as in the BFE measurement) to establish the level to which the flow energy increased because of consolidation.
The outcomes, shown in Table 2, demonstrate a rise in normal flow energy (BFE) of 230% for the tungsten with a volume reduction of 16%. For GS glass, this compares with an energy increase of 10% and only a volume reduction of 2%.
Compressibility
Compressibility can be defined as a bulk property measurement that analyzes the volume change of a conditioned sample when it is gradually compressed to allow the entrained air to escape. Although compressibility is not a direct measure of flowability, it can denote whether a powder is free-flowing or cohesive.
Tungsten has the highest sensitivity to compression (see Figure 4). Both GS and GL have extremely low compressibility, reflecting the comparatively efficient packing of the particles when in a low-stress, conditioned state. This can be attributed to their high permeability, low cohesion, and spherical shape.
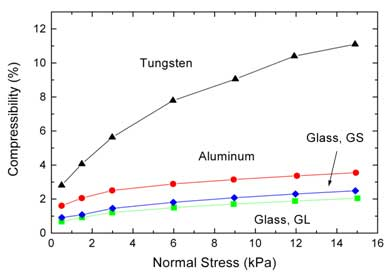
Figure 4. Compressibility as a function of applied normal stress. Image Credit: Freeman Technology Ltd
Aluminum powder exhibits median compressibility between tungsten powder and glass beads because their irregular shape and large particle size enable a degree of realignment as well as closer packing.
Permeability
Permeability is a measure of how easily a material will transmit a fluid (which is air, in this case) through its bulk. Influencing factors in the case of powders include physical properties, like cohesivity, particle size and distribution, bulk density, particle stiffness, surface texture, and shape. External factors, such as consolidation stress, also have an impact by changing the particle contact surface areas and porosity.
While granular powders are usually the most permeable, cohesive powders that mainly contain sub-30-µm-sized particles are often the least permeable. Powders with both large and fine particles may create a close packing structure, with fine particles filling the voids between particles and thus decreasing the permeability of the powder bulk. It is permeability that establishes the discharge rate of entrained air at the time of die filling.
Figure 5 depicts the difference in air pressure needed across the depth of the powder bed to sustain a continuous airflow (2 mm/second), while consolidating the powder at rising normal stresses. Although increasing stress decreases the permeability of the tungsten, it does not have much impact on other powders because of their greater particle size and lower compressibility.
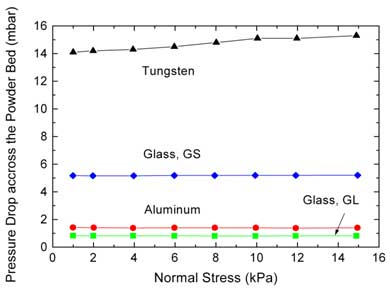
Figure 5. Pressure drop through powder bed at a constant 2 mm/second air velocity as a function of applied normal stress. Image Credit: Freeman Technology Ltd
GL and granular aluminum are more permeable when compared to the other two samples, and this high permeability can be attributed to their comparatively large void structure.
Shear Cell
Shear is the main flow mode of powders, causing particles to slide in relation to each other. High shear strength implies greater resistance to flow. The relatively high yield loci of aluminum and tungsten in comparison to glass are shown in Figure 6.
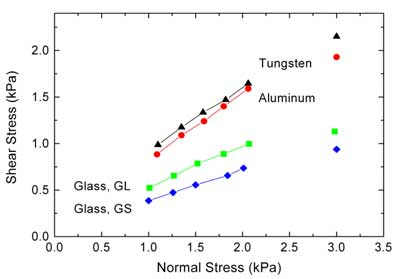
Figure 6. Shear stress versus normal stress of a sample consolidated and pre-sheared at 3 kPa normal stress. Image Credit: Freeman Technology Ltd
Shear tests were performed at 1, 1.25, 1.5, 1.75, and 2 kPa normal stresses, while samples were pre-consolidated to 3 kPa normal stress.
The derived unconfined yield strength or compression strength of the powders determines whether discharge from a hopper will stop because of the formation of a stable bridge. The internal angle of friction and cohesion value can also be derived from Figure 6 (refer to values in Table 2).
In die filling, shear properties are significant because powders retained in the dispensing shoe should shear under the influence of gravity to flow into the die, and must not bridge. Such factors will govern the mass flow rate at the time of the die filling process. If the internal angle of friction and shear stress is higher for a given normal stress, the powder will cause more problems during the initiation of flow in the process environment.
Die Filling Behavior
Die Filling Behavior of Conditioned Powder
Two successive stages are involved in gravity filling—that is, powder flow from the shoe, and powder settling/packing in the die. Many significant factors—such as powder flow properties, escape of air from the die, and escape of entrained air in the powder—impact the ratio of die filling.
For the preliminary tests, all powders were conditioned prior to die filling. The die filling ratios of conditioned powder were computed from conditioned bulk density and filled mass (refer to Figure 7). All the four powders have extremely different die filling abilities, with GL glass being the best and tungsten turning out to be the worst. Even tungsten filled well at the lowest shoe speed, but at maximum speed, the filling ratio decreased to less than 20% when compared to GL glass that continued to remain above 80%.
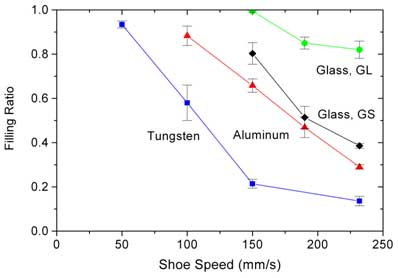
Figure 7. Die filling ratio of four different powders at different shoe speeds. Image Credit: Freeman Technology Ltd
Die Filling Behavior of Aerated and Tapped Powder
The packing condition of powder in the shoe as well as its effect on bulk density and air content influences the performance of die filling. To measure this, tungsten and aluminum were assessed in both lightly aerated and slightly consolidated states. Samples were aerated at 10 mm/second (tungsten) and 20 mm/second (aluminum), and then carefully transferred to the die filling rig.
Aerated Powder had the Best Filling Ability and Consolidated Powder the Worst
Figure 8 shows the die filling ratio of tapped tungsten powder. The impact of tapping is quite pronounced, causing the die filling ratio to further decrease by 50%, and the bulk density to increase by 16%.
A single measurement on “aerated” tungsten was made at 150 mm/second, which did not show any change from the conditioned data. Aeration in tungsten powder evidently creates channels and does not change the packing state of the bed.
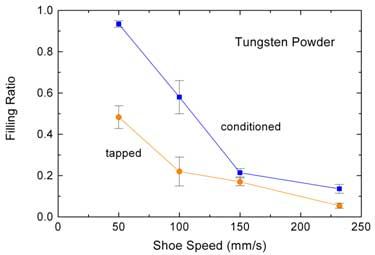
Figure 8. The die filling properties of Tungsten powder under different powder packing conditions. Image Credit: Freeman Technology Ltd
Powder Properties and Filling Performance
In total, 13 flowability and other powder characteristics were quantified. For a majority of the parameters, low values imply improved flowability while higher values indicate poorer flowability. Aeration ratio is the exception where a high value denotes good flowability and aeration.
When comparing highly analogous materials, the availability of a varied range of flowability indicators is specifically useful. Since aluminum, tungsten, and glass spheres are profoundly different, it was not absolutely necessary to quantify all parameters in this analysis.
But the data (refer to Table 2) indicates a good correlation of all parameters—the highest values for tungsten and low values for the GS glass—validating the poor flow characteristics of tungsten.
The filling ratios for all the four powders when filling at 230 mm/second are shown in Figure 7. There is a clear correlation—tungsten had the worst filling ratio and flow properties, followed by aluminum. But the glass spheres data was surprising: GS, with smaller spheres, had the best flow properties but inferior filling ratios when compared to the larger spheres of GL. This is due to the maximum permeability of GL. The potential of GL to readily discharge the entrained air enables a more thorough die filling, and this was validated by noting the bed collapse rates.
Air is a key influence and specifically significant in die filling by gravity. Important phases are:
(a) Air content of the powder prior to filling
(b) Air entrainment as powder drops from the shoe into the die
(c) Discharge of the air entrained in the powder in the die
(d) Escape of air from the die upon filling
While the first three phases directly relate to the properties of the powder discussed before, venting of the die volume (d) relies on die design and is not a part of this analysis.
The aeration data demonstrates the significance of air on flow properties (a). Because of its cohesivity and fine particle size, tungsten does not aerate. But the glass spheres are interestingly different, since GS aerates and ultimately fluidizes at comparatively low levels of air addition, while GL with high permeability needs significant air to fluidize. Thus, GS aerates quickly on die filling, giving it excellent flow properties, but once in the die, it is comparatively poor at discharging air.
Aerating powder prior to filling demonstrated that aeration enhances flow properties (excluding the fine cohesive powders) and thus improves flow into the die and provides higher filling ratios. Consolidation increases bulk density, excludes air, decreases the filling ratio, and compromises flow properties.
Conclusion
The study quantified the die filling performance of three extremely different powders and also determined the correlation with their flow properties and other characteristics. A universal powder tester was used to measure a detailed set of properties with decisive results.
A clear correlation exists between the powder properties and the die filling performance. Generally, powders that have low levels of flow energy, consolidation index, flow rate index, compressibility, cohesion, shear strength, internal angle of friction, and compression strength (UYS) fill well. But permeability is equally significant and there might be an improved permeability for powders that aerate. This is because too little permeability enables aeration but it also suppresses de-aeration. An extremely permeable powder may not fluidize or increase its entrained air until significant air is applied, but it will de-aerate quickly.
All four powders have highly different die filling performance; 4 µm tungsten is the worst and 174 µm GL glass is the best. This is because of the excellent permeability and good flow properties of the GL glass beads. The cohesive 4 µm tungsten has both poor permeability and poor flow properties.
The performance of die filling relies on the packing condition of powders present in the dispensing shoe. With 4 µm tungsten, consolidation considerably deteriorates flowability and may lead to bridging and zero filling. Powders that instantly entrain air will enhance their die filling capacity and flowability upon aeration.
To sum up, the efficiency of die filling can be estimated from data about bulk and flow characteristics. Where powders that fill suitably are available alongside challenging powders, the properties of powder correlating to “good” and “bad” can be quantified. The latest formulations may subsequently be compared with this information, and their die filling performance can be estimated.

This information has been sourced, reviewed and adapted from materials provided by Freeman Technology.
For more information on this source, please visit Freeman Technology.