The latest TMA 450 RH is an autonomous instrument that enables controlled relative humidity experiments over both wide temperature and RH ranges. Users can quantify CTE and CHE, track Tg changes and execute dynamic experiments, all under a controlled RH environment.
The TMA 450 RH sample chamber has been developed with an accurately positioned humidity and temperature sensor to offer the best control of the temperature and humidity environment of the sample.
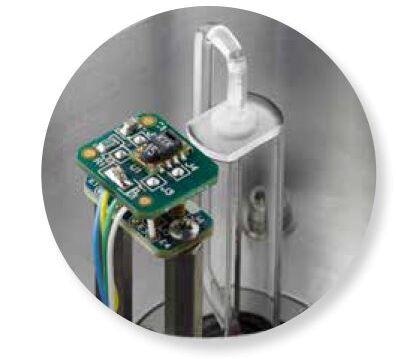
Image Credit: TA Instruments
Features and Benefits
- Widest range of RH and temperature of any instrument commercially available
- Broadest range of low-expansion quartz fixtures offering best-in-industry baseline flatness for excellent dimension change measurements
- Strong TRIOS software integrates data analysis, instrument control and reporting in a combined package to provide an unusual user experience
- Non-contact and friction-free motor provides forces from 0.001 to 2 N allowing measurements on the broadest range of samples
- The so-called innovative, “app-style” touch screen improves usability by putting instrument functionality simply One-Touch Away™
- Latest modes available for creep, dynamic, isostrain or stress relaxation experiments
Specifications
Discovery TMA RH Specifications
Source: TA Instruments
| . |
. |
| Temperature Range |
5 – 120 °C |
| Temperature Precision |
±0.1 °C |
| Heating/Cooling Rate |
0.01 – 1 °C/min |
| Humidity Range |
5 – 95% (see chart) |
| Humidity Accuracy |
5 – 90% ±3%
>90 – 95% ±5% |
| Humidity Ramp Rate |
0.1 – 2% RH/min |
| Maximum Sample Size |
26 mm |
| Measurement Precision |
±0.1% |
| Sensitivity |
15 nm |
| Force Range |
0.001 – 2 N |
| Frequency Range |
0.01 – 2 Hz |
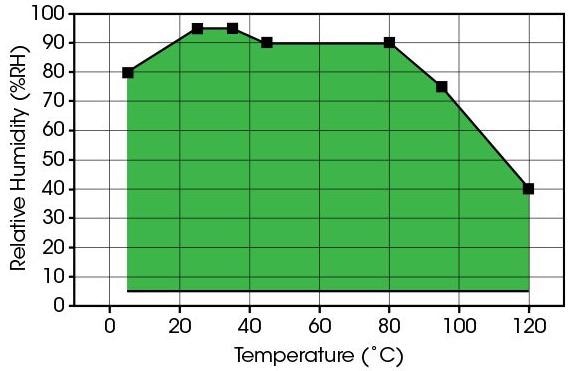
Image Credit: TA Instruments
Software
The advanced software package of the TA Instruments makes use of state-of-the-art technology for instrument control, data collection and data analysis for thermal analysis and rheology. The intuitive user interface enables users to simply and effectively program experiments, and shift easily between processing experiments and viewing and analyzing data.
TRIOS Features
- Multiple instruments can be controlled with just a single PC and software package
- One-Click analysis is offered for high productivity
- Overlay and compare outcomes throughout methods such as TMA, DSC, SDT, TGA, DMA and rheometers
- Suitable data export to plain-text, PDF, CSV, XML, Word®, Excel®, PowerPoint® and image formats
- Availability of optional TRIOS Guardian with electronic signatures for data integrity and audit trail
- Automated custom report generation, including experimental details, analysis results, data plots and tables
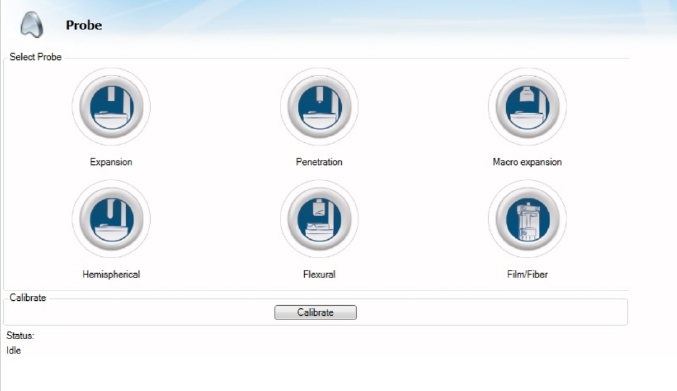
Image Credit: TA Instruments
Applications
Humidity Applications
Assessing CHE
The expansion or swelling of a material due to water uptake relies on the material’s coefficient of hygroscopicity (CHE). The plot to the right in the figure below measures this property for Kapton, an important polyimide used in the electronics industry. The plot is a sorption isotherm produced from a stepped humidity experiment. Also shown is the calculated CHE between successive points.
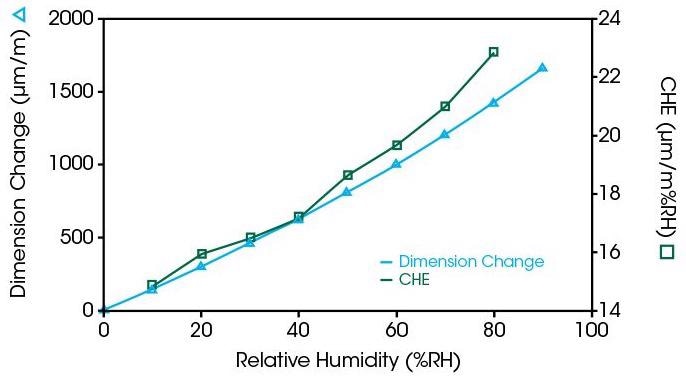
Image Credit: TA Instruments
Comparing Hygroscopicity
Perflurosulfonic Acid (PFSA) films, also called proton exchange membranes, are utilized broadly in new battery technology. Several advanced polymers should be tested for responses to humid conditions. The plot at the right in the figure below compares the hygroscopicity of commercial film against the Kapton data above. The PFSA film has roughly an order of magnitude larger response to humidity compared to the Kapton.
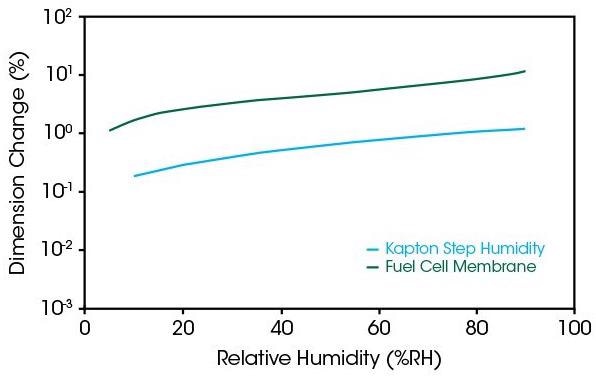
Image Credit: TA Instruments
Detecting Tg
Glass transitions are sensitive to water uptake, as the water serves as a plasticizer. Detecting and tracking changes in Tg are crucial to material function and storage. The plot to the right in the figure below illustrates the Tg of gelatin that has been utilized in pharmaceutical drug capsules captured with a RH ramp of 2% per minute at 37 °C and 50 °C. At higher temperatures, the Tg is moved to lower RH levels as a result of the higher water uptake and consequent plasticization.
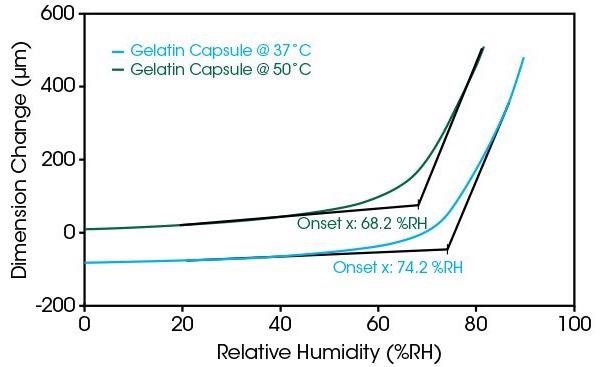
Image Credit: TA Instruments
Shrinking on Drying
Several materials shrink when dried, and it is essential to be able to comprehend the forces involved. In the plot on the right, a polymer film is retained under isostrain conditions of 0.2%, and the force necessary to retain this strain is tracked during a quick change in humidity ranging from 50% to 0%. The increase in force necessary to sustain the strain constant is quantified clearly.
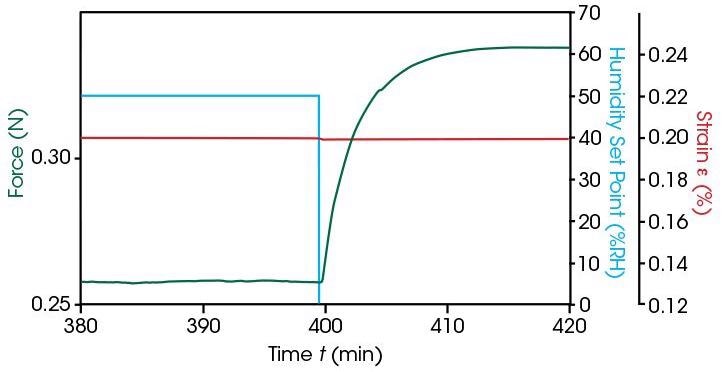
Image Credit: TA Instruments