Built to help TerraSpec® 4 mineral analyzer users to rapidly and accurately identify main minerals in a deposit, The Spectral Geologist (TSG™) mineral analysis software uses the superior quality spectral data captured using the TerraSpec 4 mineral analyzer to easily sort and examine mineral data. Besides the software’s intuitive flow and visual presentation of complex data, it offers
- Highly visual interpretation of spectral data, with a range of visualization options
- The ability to turn numerous spectra into mineralogical indices for plotting mineral features (such as composition)
- Tools to help with automatic mineral interpretation, such as The Spectral Assistant® (TSA™) and the Aux Match function
- The capacity to examine and visualize the mineralogy of large core-logging data sets
- The capability to view and plot the results down hole, or as sections, maps and scatterplots
- Simple export of critical data which can be used in other software programs for additional processing
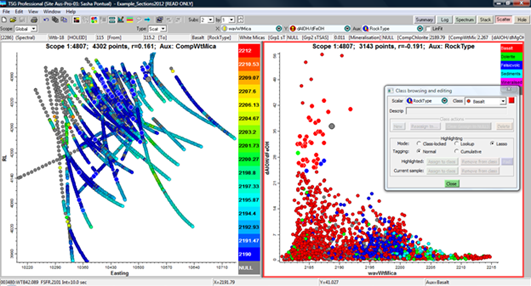
Below: The TSG Scatter Screen. Here is a spatial Easting vs. Depth plot showing about 40 drill holes together with a scatter plot of two spectral indices calculated from the spectral data. Each circle represents a sample point. The Lasso function is illustrated here, where a cluster of sample points have been lassoed in the scatter plot and their spatial positions in the Easting vs. Depth plot are highlighted.

Designed by the Commonwealth Scientific Industry Research Organization (CSIRO) in Australia, the TSG software interface has been designed especially for geological applications. The analysis methods available in TSG focus on the applications of using spectral reflectance data for mineral analysis of outcrops, drill cores, hand samples, chips, and pulps. Project data sets can be integrated and organized together to easily test using approaches such as applications of spectral parameters for automated logging/mapping, mapping mineral assemblages, deposit characterization and developing vectors to mineralization.
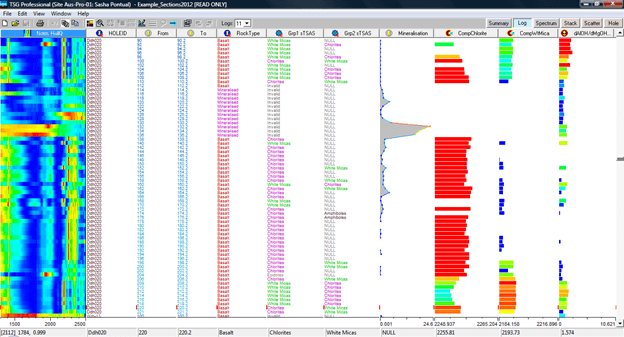
The TSG Log Screen. In this plot, the spectral analysis results (Grp1 TSAS, Grp2 TSAS, CompChlorite, CompWtMica and dAlOH/dMgOH) are compared with imported data on each sample (Hole ID, from-to depths, and mineralisation percentage). The spectral data provide useful data on the key minerals which compared with the imported mineralisation data indicate a distinct change in both the chlorite and white mica chemistries which appears to be directly associated with proximity to mineralization.

Global sales, support, and training for ‘The Spectral Geologist’ (TSG™) software is currently available through Spectral Geoscience Pty Ltd.
New Release TSG 8
Economical, flexible, time-block licenses of the newly released TSG version 8 are currently available via a secure online sales portal. TSG 8 has new functionality, an updated spectral library and enhanced processing algorithms.
Spectral Geoscience can help in utilizing ASD spectrometers and the TSG software as tools to extract qualitative and quantitative mineral data from geological samples to support the objectives of exploration geologists, geotechnical engineers, mine geologists, geometallurgists and environmental scientists.
TSG assists Halo users with:
- Functionality to construct additional scalars
- Custom import for Halo data, associated scalars and GPS coordinates
- Interactive visualization of the spectra, mineralogical information (plan view and down-hole plots) and linked core/chip/field sample photos