Aqualog® is the only instrument that can analyze both absorbance spectra and fluorescence excitation-emission matrices (EEMs) at the same time. EEMs can be obtained up to a hundred times faster than conventional equipment. Traceable Quinine Sulfate Unit calibration and correction of inner-filter effects and Rayleigh and Raman scattering lines are automated by dedicated software, allowing for speedy export to modeling algorithms, such as PARAFAC.
Aqualog now provides deep UV absorbance and fluorescence excitation from 200 nm and a completely automated sample queue tool to support continuous data collecting, analysis, and export for instant multivariate analysis using their partner, Eigenvector Research, Inc.’s Solo™ package.
ASTM D8431 Standard Test Method for Detection of Water-soluble Petroleum Oils (BTEX) by A-TEEM Optical Spectroscopy and Multivariate Analysis.
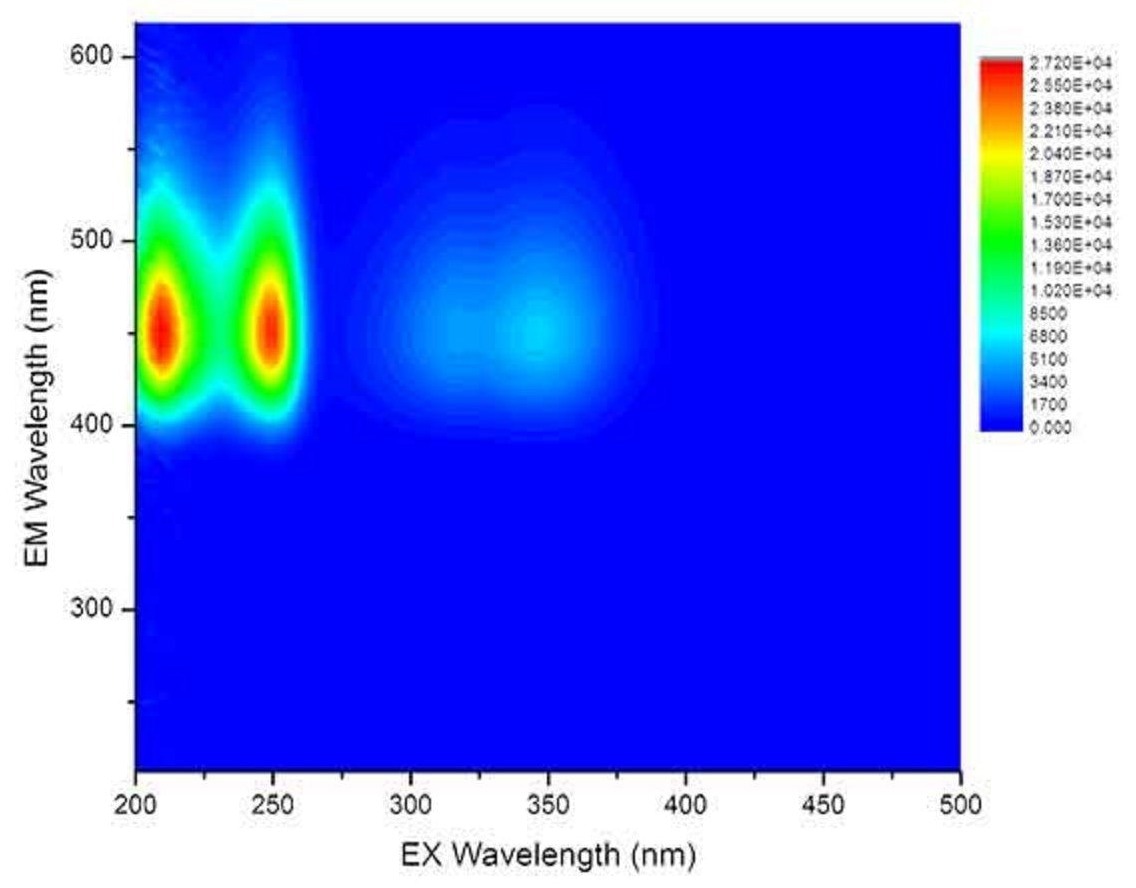
Image Credit: HORIBA Scientific
Features
Hardware
- The only true simultaneous absorbance-fluorescence system available
- Corrected UV-VIS absorbance detection path for stability and accuracy
- TE-cooled CCD fluorescence emission detector for rapid data acquisition up to 100 times faster than any other benchtop fluorometer
- Double grating excitation monochromator for superior stray light rejection
- Bandpass matching for absorbance and fluorescence spectra
- Automatic sample changer option (2 or 4 position)
- Compatible with flow cells and titrator
Software
- Optimized experiment set-up menus reduce user configuration time
- Spectral and kinetic analysis tools for both absorbance and fluorescence data
- Complete NIST-traceable corrected fluorescence spectra created automatically
- Methods and batch protocols for automating multiple sample measurement
NEW A-TEEM™ Technology
A-TEEM technology utilizes absorbance, transmittance, and EEM data to fingerprint molecules with high specificity and ultrahigh sensitivity at a 6 million nm/minute emission scan rate.
All colored molecules have distinct molecular absorbance and transmittance spectra, and many of them have distinct fluorescence excitation and emission spectra that may be quantified as an excitation-emission matrix (EEM). A new technology (A-TEEM) that combines absorbance-transmission and EEM simultaneously produces a distinct chemical fingerprint with several possible applications.
Aqualog integrates an ultrafast CCD up to 4,000 times quicker than typical PMT-based fluorometers with the innovative A-TEEM technology to quickly identify, quantify, and comprehend individual organic molecules in complicated mixtures. A-TEEM has proven more effective than HPLC and vibrational spectroscopy in protein, vaccine, wine, and water research, quality, and process applications.
NEW Aqualog® Datastream Dashboard
Features
- Easy integration with Aqualog
- Feasible HTML-based interface
- Push-button method operation
- Simple administrator-level controls for calibration and method development
Benefits
- Effortless access through the internet or intranet
- A dashboard displays the latest readings, time series, and tables for trends and analysis
- WTP can upload their own independent data
NEW HORIBA Multi-Model Predictor Tool
HORIBA Instruments is pleased to announce the release of a new software tool designed to automate multivariate and machine learning analysis workflows for HORIBA’s patented Aqualog Absorbance-Transmission Fluorescence Excitation Emission Matrix (A-TEEMTM) spectrometer’s industrial QC/QA applications.
Key applications of HMMP tool
- Wine and grape quality chemistry (anthocyanins, phenolics, tannins, sulfites, etc.)
- Grain mold and odor compounds
- Water contamination (algae, oil, and other materials)
- Pharmaceuticals (vaccines, drugs, cell media)
- Cannabinoids
- Olive oil adulteration and spoilage
- Dietary supplement adulteration
Key features and benefits
- Fast and simple operator-level analysis
- Facilitated administration of method model development and editing
- Complete parameter profile and classification reports
- Compatible with laboratory information management systems
- HMMP Add-In is completely integrated into Eigenvector Inc. Solo/Solo+Mia and explicitly activated and supported by HORIBA Instruments Inc.
NEW Automatic Sipper Accessory
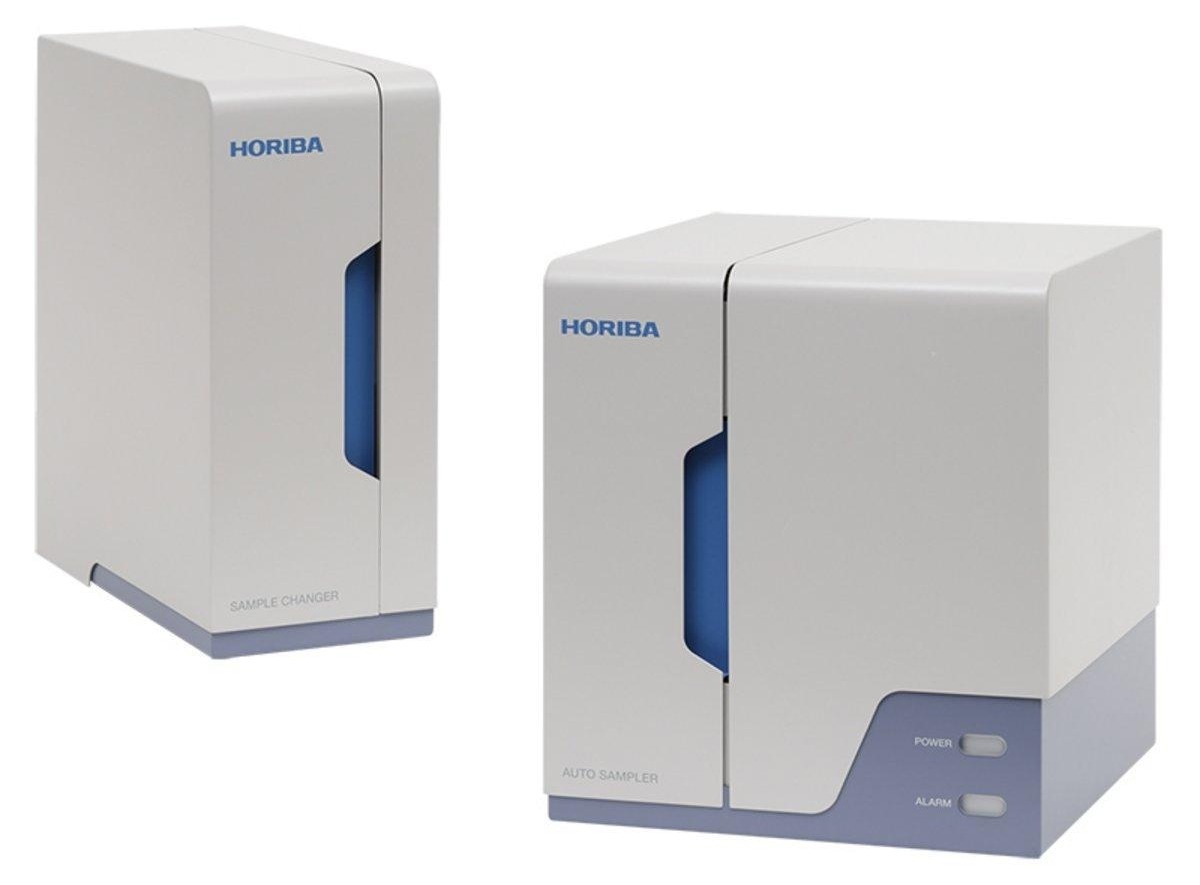
Image Credit: HORIBA Scientific
The Aqualog automatic sipper accessory, new for the Aqualog® A-TEEMTM spectrometer, handles sampling from a single source and dispensing rinsing solutions, detergents, and managing reverse-flow drainage. The 4-sample changer unit attaches to the main sipper unit and allows sampling from up to four different sources.
The sipper is simple to install and use, with built-in automatic cleaning, leak detection, and protection. It is completely integrated into the new Aqualog 4.0 batch analysis software and has many applications in water, pharmaceutical, beverage phenolics, and other fields.
The sipper and four-channel attachment allow the Aqualog to automatically extract and monitor raw, settling, and finished water samples when used at a water treatment plant. Each sample changer device is designed to work with overflow and filtration.
Specifications
Table 1. Source: HORIBA Scientific
| Fluorescence Hardware |
| Light source |
Extended-UV: 150W vertically mounted xenon arc lamp |
| Excitation range |
200 nm to upper limit of emission detector |
| Excitation bandpass |
5 nm |
| Excitation monochromator |
Subtractive double monochromator |
| Excitation gratings |
1200 gr/mm, 250 nm blaze |
| Excitation wavelength accuracy |
±1 nm |
| Choice of Detector |
Red-extended |
| Emission range |
250-800 nm |
| Emission grating |
285 gr/mm; 350 nm blaze |
| Hardware pixel binning |
0.58, 1.16, 2.32, 4.64 nm/pixel |
| Emission bandpass |
5 nm |
| Emission spectrograph |
Fixed, aberration-corrected 140 mm focal length |
| Emission detector |
TE-cooled back-illuminated CCD |
| Emission integration time |
5 ms minimum |
| CCD gain options |
2.25 e-/cts in high gain, 4.5 e-/cts in medium gain, 9 e-/cts in low gain |
| Sensitivity |
Water-Raman SNR > 20,000:1 (RMS method) (350 nm excitation, 30s integration) |
| Weight |
32.72 kg (72 lbs) |
| Dimensions |
LWH (618 x 435 x 336 mm); (24" x 17" x 13") |
Table 2. Source: HORIBA Scientific
| Absorbance Hardware |
| Scanning range |
200-800 nm (UV lamp) |
| Bandpass |
5 nm |
| Slew speed |
Maximum 500 nm/s |
| Optical system |
Corrected single-beam |
| Detector |
Si photodiode |
| Wavelength accuracy |
+/- 1 nm |
| Wavelength repeatability |
+/- 0.5 |
| Photometric accuracy |
+/- 0.01 AU from 0 to 2 AU |
| Photometric stability |
<0.002 AU per hour |
| Photometric repeatability |
+/- 0.002 AU (0 to 1 AU) |
| Stray light |
<1% measure with Kl standard |
Applications
Trihalomethane speciation modeling in drinking water using the A-TEEM spectroscopic technique and multivariate data analysis
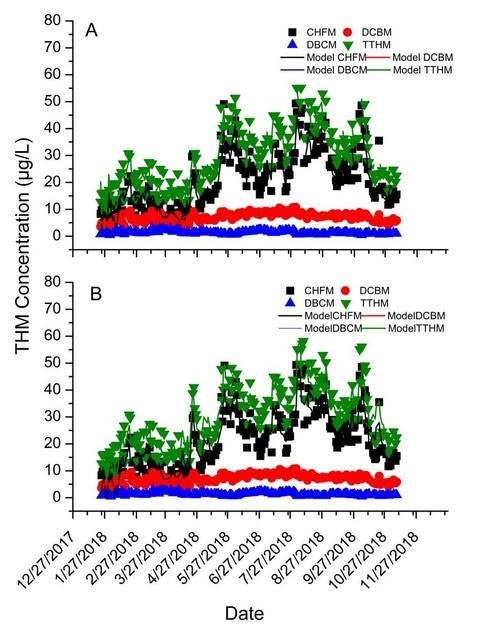
Image Credit: HORIBA Scientific
A quick and sensitive nondestructive disinfection byproducts (DBP) prediction method employing patented simultaneous absorbance-transmittance and fluorescence excitation-emission matrix (A-TEEM) spectroscopy.
Identification and quantification of potential adulterants in cranberry fruit juice dry extracts using absorbance-transmittance excitation-emission (A-TEEM) spectroscopy

Image Credit: HORIBA Scientific
The Aqualog A-TEEM spectrometer can particularly identify and sensitively quantify major adulterants found in cranberry dietary supplements, such as pine bark, grape seed, and peanut skin extracts.
A-TEEM fluorescence for identification and quantification of fulvic acid adulteration in commercial humic products
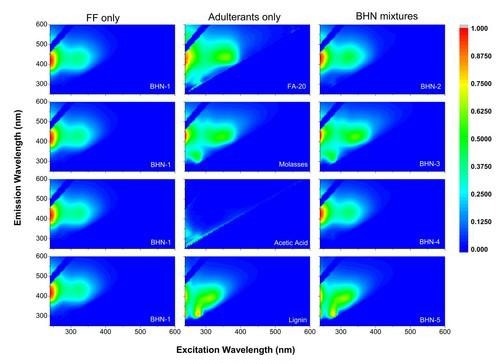
Image Credit: HORIBA Scientific
The A-TEEM molecular fingerprinting technique easily distinguishes distinct components in mixtures containing FF and other adulterants, such as lignosulphonates, organic acids, and molasses, and gives a quantitative evaluation of mixtures.
Rapid extra virgin olive oil classification and blend quantitation

Image Credit: HORIBA Scientific
The growing interest in the Mediterranean diet and its related health advantages has focused on the role of extra virgin olive oil. As people become more aware, product demand rises, as do chances to compromise quality. As a result, quick analytical methods for performing quality analysis on diverse product samples are required.
Monitoring cell culture media variability using a simple optical technique (A-TEEM molecular fingerprinting)

Image Credit: HORIBA Scientific
With the increased usage of mammalian cell culture for protein production, controlling the quality of cell culture media used in manufacturing has become increasingly vital. Cell culture media are typically created as aqueous solutions and should contain everything a cell line requires for optimal cell growth, product yield, and quality.
Classification and phenolics analysis of red wines with A-TEEM molecular fingerprinting

Image Credit: HORIBA Scientific
Aqualog® is an analytical instrument that measures absorbance, transmission, fluorescence excitation, and emission matrix (A-TEEM) simultaneously. A-TEEM fingerprints reveal the qualitative and quantitative composition of important flavor and color factors in wine and spirits that are not detectable using traditional absorbance or transmission data analysis.
Spectroscopic analysis of red wines with Aqualog
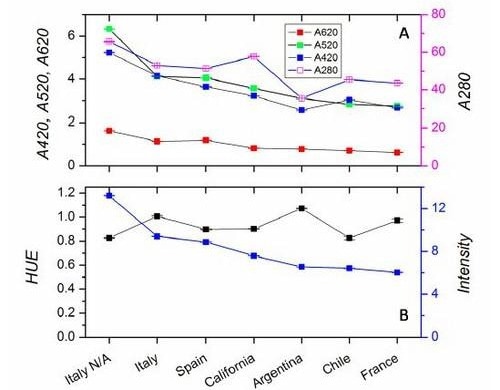
Image Credit: HORIBA Scientific
The Aqualog from HORIBA is the only one with proprietary simultaneous absorbance spectral and fluorescence excitation-emission matrix (EEM) technology, allowing quick access to various parameters vital in commercial wine processing and quality characterization.
Harmful algal blooms (HABs)
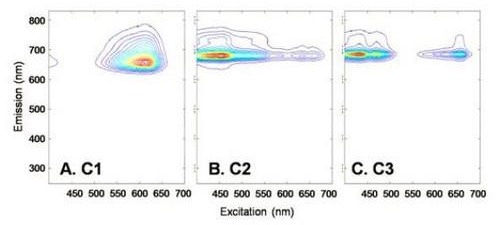
Image Credit: HORIBA Scientific
Using simultaneous absorbance and fluorescence excitation-emission matrix (EEM) analysis for identifying and classifying freshwater planktonic algal species.
Holistic analysis of mammalian cell proliferation using fluorescence spectroscopy
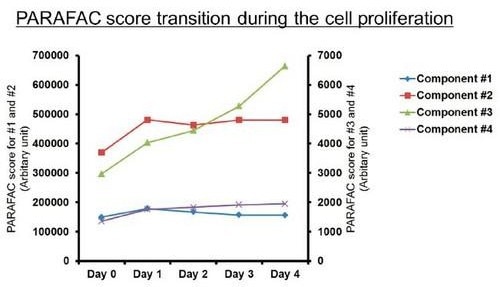
Image Credit: HORIBA Scientific
Assessing culture media conditions is essential for sectors looking to optimize cell proliferation for applications such as regenerative medicine and protein synthesis.
Disinfection byproducts (DBPs) and precursors in drinking water for EPA compliance
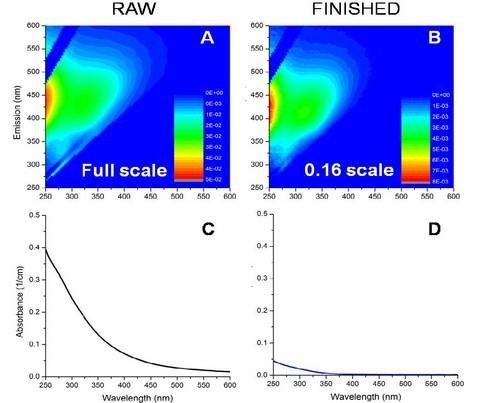
Image Credit: HORIBA Scientific
The Aqualog monitors regulated dissolved organic matter (DOM) and disinfection by-products in drinking water treatment.
Fast and non-invasive determination of skin state
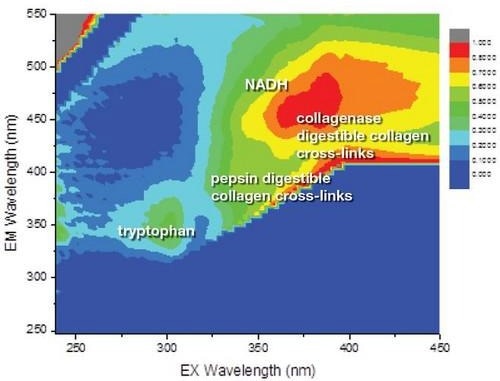
Image Credit: HORIBA Scientific
Biological tissues contain chromophores, which absorb light, and fluorophores, which absorb and reemit light (fluorescence effect). Light absorption is affected by the chromophores’ content and distribution within organic matter.
Insulin structure and stability assessment
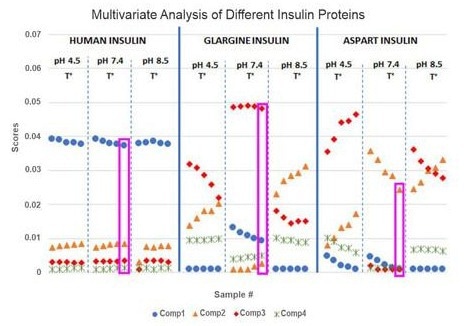
Image Credit: HORIBA Scientific
Stability and aggregation of insulin are investigated by employing simultaneous fluorescence excitation-emission matrices (EEMs) and UV-Vis absorbance spectroscopy. Insulin is a protein hormone produced by the pancreas that is required for fundamental metabolic functions.
Commercial insulin therapeutics are divided into two types: short-acting insulin and long-acting insulin. In some circumstances, the difference between short-acting and long-acting insulin is only one to three residues in the protein sequence.
Noninvasive in-vivo determination of sunscreen-UVA protection factors
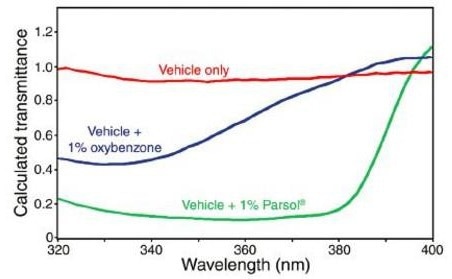
Image Credit: HORIBA Scientific
UVA (320–400 nm) sunscreen development and testing is essential since UVA rays may penetrate deep into human skin and inflict serious internal damage, and also erythema and photoaging.
Milk compounds characterization by optical spectroscopies and laser diffraction
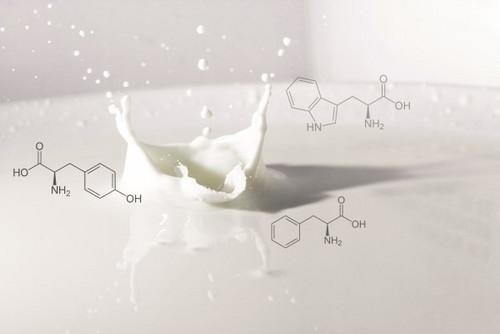
Image Credit: HORIBA Scientific
Compound characterization is a vital stage in the food industry to assure product quality or to provide information to customers who may be sensitive to allergies. Optical spectroscopies and laser diffraction can aid in characterizing food constituents, specifically milk.
Spectroscopic methods for sunscreens characterization
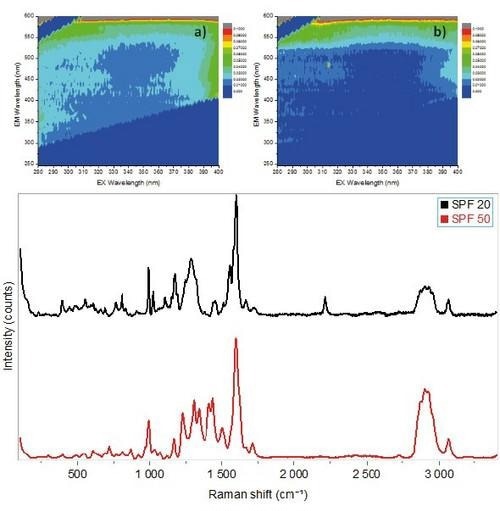
Image Credit: HORIBA Scientific
Three different kinds of spectroscopic tools are being used to characterize sunscreens. These include fluorescence spectroscopy for photoactivity, particle size analysis for composition, and Raman microscopy for formulation investigation.